Stop guessing what your churn rate actually means. This is where you get real answers and actionable playbooks from SaaS operators who have been in the trenches.
We've embedded our Churn Rate Calculator with AI Analysis right here because figuring out your churn is the first step to finally fixing it. Think of it as your secret weapon for turning a messy pile of data into a single, actionable metric that drives real growth.
Your Free Churn Rate Calculator with AI Analysis
This isn't just another basic calculator. Sure, it spits out your churn percentage in a snap, but its real value is in the context it provides. Most calculators just give you a number, leaving you to wonder, "Okay, now what?" That's a classic sticking point for SaaS operators—you get a metric, but you have no idea what to do with it.
Our approach is different. Our free tool goes a step further, performing an AI analysis on your numbers to give you immediate insights. We know a 5% churn rate can be a disaster for one company and a Tuesday for another. It all depends on your business model, customer base, and growth stage.
From Raw Data to Smart Decisions
The goal here isn't just to measure churn; it's to eliminate it. This tool is designed to be the jumping-off point for a smarter retention strategy. It gives you a reliable baseline so you can start digging into the why behind your cancellations and build playbooks that actually keep customers around.
As an operator, your churn rate is one of the most honest pieces of feedback you'll ever get. It tells you exactly how much value your product is delivering—or failing to deliver—over time.
I’ve seen too many founders get completely bogged down in spreadsheets, manually tracking every cancellation and renewal. This tool gets rid of that headache, freeing you up to focus on what matters: analysis and action, not mind-numbing calculations.
So, You Have Your Number. What's Next?
Once the calculator gives you that magic number, the real work begins. Is the churn coming from new users who never got the "aha!" moment, or from long-term customers who've slowly lost faith? This initial calculation is your first clue.
For a much deeper dive, you can run a full churn diagnosis to uncover the hidden stories in your data. That's how you go from just knowing your churn rate to actively driving it down, quarter after quarter.
Calculating Churn Rate the Right Way
Alright, let's get down to the numbers. Figuring out your churn rate isn't some vanity metric for your dashboard—it's a critical health check for your entire SaaS business. It’s all about understanding who’s walking out the door and how much cash they're taking with them.
There are two numbers every SaaS operator should be tracking obsessively: Customer Churn and Revenue Churn. They might sound like two sides of the same coin, but they tell completely different stories about what’s really going on.
Customer Churn: The Simple Headcount
Customer churn is the one everyone knows. It’s straightforward and answers a basic question: "How many customers did we lose this month?" It's a pure headcount, plain and simple.
The formula is as clean as it gets:
(Customers Lost During Period / Customers at Start of Period) * 100
Let’s make this real. Imagine a B2B SaaS company called "SyncUp" that sells project management software. On April 1st, they have 500 paying customers. By the end of the month, 25 of those customers have canceled.
Plugging that into the formula:
(25 Lost Customers / 500 Starting Customers) * 100 = 5%
So, SyncUp has a 5% monthly customer churn rate. That might not sound like a five-alarm fire, but it's only half the story. A lot of founders stop here, and that's a huge mistake because they miss the much bigger financial picture playing out behind the scenes.
Revenue Churn: The Financial Truth
This is where the real story is. Revenue churn, or MRR Churn, tells you how much money you lost, not just how many logos walked away. This number often hits much harder because it reveals the true financial damage. Losing one enterprise client can hurt way more than losing a dozen small startups.
The formula looks similar, but we're swapping heads for dollars:
(MRR Lost During Period / MRR at Start of Period) * 100
Let's stick with SyncUp. Of those 25 customers they lost, 20 were on their "$50/month Starter" plan, but 5 were on their beefy "$3,000/month Enterprise" plan.
- Loss from Starter plans: 20 * $50 = $1,000
- Loss from Enterprise plans: 5 * $3,000 = $15,000
- Total MRR Lost: $16,000
Now, let's say SyncUp started April with $350,000 in Monthly Recurring Revenue (MRR). The revenue churn calculation tells a very different tale.
( $16,000 Lost MRR / $350,000 Starting MRR ) * 100 = 4.57%
SyncUp's 4.57% MRR churn is actually a little better than their customer churn. But what if those numbers were flipped? If they lost 20 enterprise clients and only 5 small ones, the financial impact would be devastating, even if the customer churn number looked totally fine.
A founder I know had a massive 'aha!' moment seeing this in action. Their customer churn was a steady 3%, which seemed manageable. But their revenue churn was creeping toward 10%. They were doing a great job keeping small accounts happy but were bleeding cash from high-value clients who felt ignored. Separating these two metrics literally saved their business.
This distinction is exactly why you have to understand the different types of churn in SaaS. It’s non-negotiable for growth. If you only look at the customer count, you could be masking serious problems with your pricing, product-market fit, or support for your most important accounts.
There's a reason free tools for tracking this are everywhere. Even a tiny improvement can have an outsized impact on your bottom line. In fact, some studies show a mere 1% reduction in churn can boost profits by up to 125%. You can read more about these SaaS churn benchmarks to see just how powerful small changes can be.
What Your Churn Rate Is Actually Telling You
Getting a number from a churn rate calculator free tool is the easy part. The real work—the part that separates a growing SaaS company from one that's just spinning its wheels—is understanding the story that number is trying to tell you.
Think of your churn rate as one of the most honest health indicators for your business. It’s a diagnostic tool. If the number is high, it's a clear symptom of a deeper problem. It could be pointing to a clunky onboarding process, a critical missing feature, unresponsive customer support, or even a fundamental mismatch between your pricing and the value you deliver.
Context Is Everything: What Is a Good Churn Rate?
So, what’s a "good" churn rate? It's completely relative. A 5% monthly churn might be great for a B2C mobile app with a low price point, but it would signal an absolute catastrophe for an enterprise SaaS platform built on long sales cycles and high customer acquisition costs.
The difference comes down to the business model:
- SMB & B2C Focused: These businesses typically deal with a higher volume of lower-value customers. A higher churn rate is often expected and is managed by pouring resources into high-volume customer acquisition.
- Enterprise Focused: These businesses rely on a smaller number of high-value, long-term contracts. Losing even a single client can be a major financial blow, so their churn needs to be as close to zero as humanly possible.
To see how you stack up, you can explore more detailed churn rate benchmarks by industry. For instance, many enterprise software companies aim for 3-5% annual churn, while some fintech platforms might see 12-24% annually and still be considered healthy.
Digging Deeper Than the Headline Number
A single churn percentage is just the surface. To get real, actionable insights, you have to segment your data. As we covered, the first critical step is separating Customer Churn from Revenue Churn. This tells you if you're losing lots of small customers or a few big ones.
This infographic shows a simple visual comparison between the two.
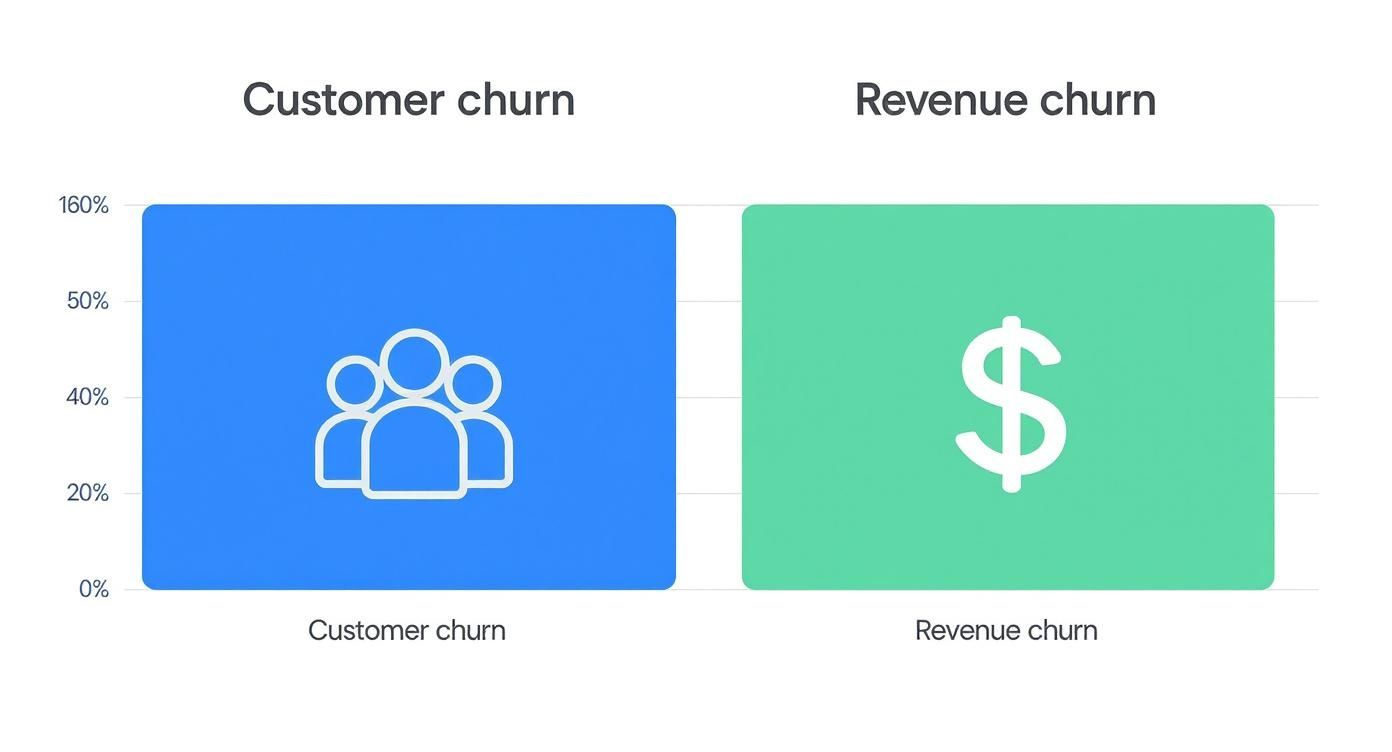
The key takeaway here is that you can have low customer churn but high revenue churn—a dangerous combination that often goes unnoticed until it's too late.
This is exactly why so many successful operators obsess over metrics like the net retention rate, which factors in expansion revenue from existing customers. The ultimate goal for a healthy SaaS business is achieving a negative churn rate, where the revenue from upgrades and cross-sells outpaces the revenue lost from churn.
From Diagnosis to Action
Once you have a benchmark, you can start asking the right questions. Is churn higher among customers who skipped the onboarding tutorial? Are users on a specific pricing tier leaving more often? Does churn spike 90 days after sign-up?
A fellow SaaS operator once told me they discovered their highest churn came from customers who never integrated their tool with Slack. The product worked fine without it, but the integration created "stickiness." They revamped their onboarding to push the Slack integration, and their churn dropped by 2% within a quarter.
This is the real power of interpreting your churn data. It moves you from passively watching customers leave to proactively understanding why they leave and fixing the root cause.
To get you started, here’s a quick look at some common churn benchmarks across different SaaS sectors.
SaaS Industry Churn Rate Benchmarks
This table provides a simple comparison of average monthly and annual churn rates. Use it to get a feel for where you stand within your specific niche.
| SaaS Industry | Average Monthly Churn Rate | Acceptable Annual Churn Rate |
|---|---|---|
| Enterprise SaaS | 0.5% – 1.5% | < 10% |
| SMB SaaS | 2.5% – 5% | 25% – 50% |
| FinTech | 1% – 2% | 12% – 24% |
| EdTech | 2% – 4% | 20% – 40% |
| Marketing Tech | 3% – 5.5% | 30% – 55% |
Remember, these numbers aren't absolute rules—they're a starting point. Your real goal is to find your own baseline and then relentlessly work to improve it, using the insights your churn rate provides to build a better product and a stickier customer experience.
Common Pitfalls That Skew Your Churn Data
Getting a churn number is one thing; actually trusting it is something else entirely. A slightly off churn calculation can send you chasing the wrong problems and making dangerously bad business decisions. It's usually the small, overlooked details that hide the biggest threats to your growth.
I see it all the time: SaaS operators track a top-line churn metric that looks pretty good on a chart but masks serious issues bubbling under the surface. The goal isn't just to get a number—it's to get to your true churn rate.
Let's dig into the common traps that can completely skew your data and how you can sidestep them.
Mixing Up Monthly and Annual Contracts
This is probably the most common way founders accidentally mislead themselves. If you have both monthly and annual subscribers, just lumping them all into a single monthly churn calculation is a recipe for disaster.
Think about it. Say you have 100 annual subscribers up for renewal in January, and 10 of them decide not to stick around. If you only look at your overall monthly churn, those 10 lost customers might barely move the needle. But the reality is you just lost 10% of that specific annual cohort. That’s a big deal.
One B2B SaaS company I know had a beautifully low monthly churn rate for nearly a year. They felt untouchable. What they missed was that a huge batch of their initial annual contracts was about to come up for renewal, and their engagement with those customers had been radio silence. When renewal month finally hit, their churn rate went through the roof, catching them completely off guard.
To get an accurate picture, you absolutely have to track your annual renewal rate separately. It gives you a much clearer, long-term view of customer loyalty that a simple monthly churn rate just can't provide.
The Problem with Paused Subscriptions
So, what do you do with a customer who pauses their account? They haven't officially canceled, but they aren't paying you, either. If you keep them in your "active customer" count, you're just artificially deflating your churn rate.
A paused subscription is a customer teetering on the edge of churning. While it's certainly better than an outright cancellation, treating them as a fully retained customer is just bad data hygiene.
The best practice here is simple: remove them from your active user count for the period they are paused. This keeps the denominator in your churn formula (Total Customers at Start of Period) honest and gives you a much more realistic metric.
Ignoring Involuntary vs. Voluntary Churn
Not all churn is created equal. Lumping every lost customer into one giant bucket is a massive strategic mistake. To take the right action, you need to segment your churn into at least two primary categories.
- Voluntary Churn: This is when a customer actively decides to leave. They logged in, navigated to the billing page, and clicked "cancel." This kind of churn points to a problem with your product, pricing, or customer experience.
- Involuntary Churn: This happens when a customer churns because of a failed payment—an expired credit card, insufficient funds, or a random bank rejection. This is a mechanical problem, not necessarily a value problem.
Why does this distinction matter so much? Because the playbooks to fix them are completely different. You fight voluntary churn with better onboarding, new features, and proactive support. You fight involuntary churn with dunning emails, credit card update prompts, and smart payment retries.
Industry data shows involuntary churn can account for 20-40% of your total churn. Ignoring it means you're leaving a huge chunk of recoverable revenue on the table.
Ultimately, your goal is to build a reliable, trustworthy view of your key metrics. By tracking these different churn types and other KPIs, you can create a much more powerful and accurate dashboard for your SaaS KPIs in Excel or whatever BI tool you're using.
So You've Got Your Churn Rate. Now What?
Alright, running the numbers through a churn rate calculator free tool is a great start. But let's be real—a number by itself doesn't fix anything. It's a diagnostic, not a cure. The real work begins now, turning that data into action.
Forget the generic advice. I'm going to walk you through three specific playbooks we've seen work time and time again in the real world. These aren't theoretical concepts; they're grounded strategies you can start on this week to plug the leaks in your bucket.
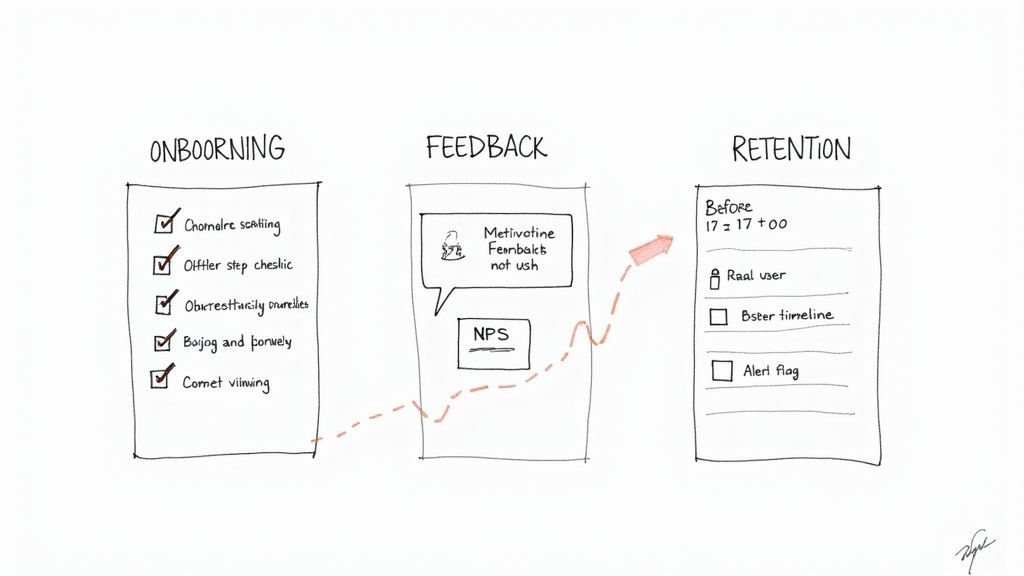
Playbook 1: The Onboarding Overhaul
The first 30 days make or break a customer relationship. If they don't get that "aha!" moment and see your product solving a real problem for them, they're not sticking around. This playbook is all about redesigning your onboarding from a passive product tour into a guided journey to their first win.
Most onboarding is a huge miss. It shows users what all the buttons do but fails to show them how to achieve the outcome they signed up for. Think about Slack. They're masters at this. They don't just point out what channels are; they nudge you to join relevant ones and send that first message, getting you hooked from day one.
Here's Your Game Plan:
- Define Your Activation Moments: What are the 2-3 things a new user absolutely must do to realize your product's value? Is it creating their first report? Inviting a teammate? Setting up a key integration? Pinpoint them.
- Build an Interactive Checklist: Don't just give them a boring list of tasks. Create an in-app checklist they can physically tick off. It gamifies the experience and gives them a satisfying sense of progress.
- Automate Proactive Nudges: If a user hasn't hit that first key milestone in 48 hours, don't wait. Automatically send a friendly email with a quick GIF showing exactly how to do it. If they still seem stuck, offer a link to book a quick 15-minute call.
Make no mistake, bad onboarding is a churn factory. When you lump it in with weak relationship-building and poor service, it's responsible for a staggering 53% of all churn.
Playbook 2: The Customer Feedback Loop
You can't fix a problem you don't know exists. This playbook is about building a system to consistently listen, categorize, and act on what your customers are telling you—especially the quiet ones.
The classic mistake is only asking for feedback in the exit survey when they're already out the door. That's an autopsy. You need a living, breathing feedback loop that actively informs your product roadmap and CS strategy.
Here's How to Build It:
- Nail the Exit Survey: When someone cancels, ask one killer question: "What's the main reason you're leaving?" Give them multiple-choice options for easy data, but always include an "Other (please explain)" field. That's where the gold is.
- Run Quarterly NPS Surveys: Use the Net Promoter Score (NPS) to get a pulse on overall sentiment. The score is just a number, though. The real work is personally following up with your Detractors (those who score you 0-6) to understand why.
- Tag and Track Everything: Get this feedback into a system, even if it's just a spreadsheet to start. Tag every piece of feedback by theme: "Missing Feature," "Buggy UI," "Too Expensive," "Slow Support." This is how you spot the patterns before they become fires.
I worked with a founder who did this and found that 15% of their churn came from customers who needed a specific integration they'd dismissed as a niche request. They built it in a two-week sprint and churn from that user segment basically evaporated.
This entire process is a pillar of any solid customer success playbook for SaaS because it turns users from passive consumers into active partners.
Playbook 3: Proactive Retention Moves
The cheapest churn to fix is the churn that never happens. This playbook is about using your own product data to spot at-risk users and reach out before the thought of canceling even crosses their mind.
If you're waiting for a customer to send an angry email, you've already lost. A proactive strategy means watching for the subtle signs of disengagement—a drop in logins, key features going unused—and stepping in with a helping hand.
Your Proactive Checklist:
- Define "At-Risk" Signals: Get your team together and decide what disengagement looks like for your product. Is it no logins for 14 straight days? A 50% drop in a key activity? Ignoring a new "sticky" feature you just launched?
- Set Up Automated Alerts: Use your analytics tool to create triggers. When a customer's behavior matches an at-risk signal, have it automatically notify the right person on your customer success team.
- Launch a Re-Engagement Play: As soon as a user is flagged, trigger a personalized outreach. It could be an automated email with a helpful tip, an in-app pop-up showing them a feature they haven't tried, or a personal check-in from their account manager.
For those looking to get more advanced, this is where AI can be a game-changer. A great next step is looking into building an AI retention bot to combat customer churn, which can automate this outreach at scale. By acting on these data-driven signals, you can save customers you never even realized were about to walk away.
Burning Questions About Churn Rate
Even after you've crunched the numbers and stared at the data, a few key questions always seem to pop up. Let's get them answered so you can stop analyzing and start taking action.
How Often Should I Actually Calculate Churn?
For most SaaS companies, monthly is the magic number. It’s the sweet spot—frequent enough to catch new trends and see if your retention efforts are paying off, but not so often that you’re reacting to daily statistical noise.
But one size doesn't fit all. The right cadence really depends on your stage:
- Early-Stage Startups: You might want to track this weekly. When you’re pushing new features and iterating quickly, you need immediate feedback on what’s landing with customers and what’s causing them to bail.
- Businesses with Annual Contracts: You need to look at two numbers. Keep an eye on your monthly churn to monitor the short-term health of your user base. But the real truth lies in your annual renewal rate, which gives you a clearer picture of long-term loyalty.
Is a Negative Churn Rate Even Possible?
Absolutely. In fact, it's the holy grail of SaaS. When you hit negative churn, you've officially built a business that can grow even without adding a single new customer.
Negative churn happens when the new revenue from your existing customers (expansion MRR) is greater than the revenue you lose from cancellations (churned MRR).
Think about it like this: You lose $5,000 in MRR from customers who cancel this month. But in that same time, your happy, existing customers upgrade their plans or buy add-ons, generating $7,000 in fresh MRR. Your net churn is actually -$2,000. You just grew by two grand from the customers you already had.
That’s the sign of a product that's becoming indispensable. Customers aren't just sticking around; they're embedding your tool deeper into their daily operations and paying you more for the value.
What Is Churn Really Telling Me?
On the surface, churn is just a measure of customer attrition—how fast subscribers are heading for the exit. But it goes way deeper than that.
Your churn rate is a direct reflection of how well you're delivering on your promise. A high churn rate is a warning sign that there’s a gap between what you sold them and the value they're actually getting. If you need a quick refresher, here’s a great breakdown of what churn rate means.
But the real magic isn't in the overall number. It's in the segments. Are you losing brand-new customers in their first 30 days, or are ten-year veterans suddenly leaving? Are they churning because of price, a missing feature, or a frustrating support experience? Don't just obsess over the "what"—the percentage. You have to relentlessly dig into the "why" behind every single cancellation.
Ready to stop guessing and start acting on your churn data? The SaaS Operations Churn Rate Calculator with AI Analysis is a free tool designed for operators like you. It doesn't just give you a number; it provides the insights you need to build a stronger, more profitable business.