Build a Dashboard KPI Excel Your Team Will Actually Use
Building a KPI dashboard in Excel is your first real step toward making sense of all the data your SaaS business is generating. It’s about turning a chaotic jumble of numbers into a clear, actionable story. Think of it less like another spreadsheet and more like a command center for your entire operation—the one place you can go to track performance and make confident decisions that actually drive growth.
Why an Excel KPI Dashboard Is a SaaS Game-Changer
Let's be real: in the SaaS world, "winging it" with your data is a recipe for disaster. Relying on gut feelings or trying to piece together fragmented reports from a dozen different tools just doesn't work. It leads to missed opportunities and, frankly, some pretty costly mistakes. The goal here isn't to create more spreadsheets; it's to build a single source of truth that powers every strategic move your team makes.
A well-built Excel dashboard is absolutely non-negotiable for any serious operator. And I'm not talking about generic vanity metrics. We need to focus on the numbers that truly define the health of a SaaS business. A sharp, focused dashboard puts your most critical data points front and center, so you can answer the big questions in a heartbeat:
- Is our Monthly Recurring Revenue (MRR) actually growing at a healthy clip?
- What’s our Churn Rate, and more importantly, what's causing it?
- Is our Customer Lifetime Value (LTV) high enough to justify what we're spending to get new customers?
From Data Chaos to Operational Clarity
So many founders I know start out by manually pulling data from Stripe, HubSpot, and their product analytics into separate files. This instantly creates data silos where nobody has the full picture.
I worked with one SaaS operator who used to burn the first two days of every single month just compiling reports for their investor updates. The whole process was painfully slow, riddled with copy-paste errors, and by the time the insights were presented, they were already stale.
By building a centralized KPI dashboard in Excel, they completely automated the data pull and all the calculations. This didn't just free up their time; it gave them real-time visibility into the business. They could finally spot churn risks as they were happening, not weeks after the fact. One of the first things they discovered? Customers on a specific pricing tier were churning at a 2x higher rate—an insight that was completely buried before.
For a SaaS operator, your Excel dashboard is your operational pulse. It tells you where you are, where you've been, and where you're heading. Without it, you're flying blind.
More Than Just a Report
The real magic of a great Excel dashboard is how it gets everyone on the same page. It aligns your entire team—from marketing and sales to product and support—around the same goals and the same numbers.
When everyone is looking at the same data, the conversations change. You stop debating whose numbers are right and start deciding on what to do next. That shared understanding is the bedrock of an efficient, data-driven SaaS operation.
A dashboard is also the perfect entry point for creating more structured performance management tools. You might be interested in seeing how these dashboards can evolve into comprehensive business scorecards that drive accountability and strategic alignment across your entire company.
Laying the Groundwork for a Flawless Dashboard
This is where most dashboards fail before they even start. A killer dashboard KPI in Excel isn't about flashy charts; it's built on a bedrock of clean, organized, and trustworthy data. Too many people jump straight into making graphs, only to watch their formulas break and their insights crumble because the data underneath is a complete mess.
Before you even dream of a pivot chart, you need to get your data structure right. A shaky foundation guarantees a dashboard that will collapse, forcing you into a nightmare of manual fixes and killing any trust in the numbers.
The Golden Rule of Data Layout
Every operator who’s been in the trenches learns this lesson, often the hard way: your raw data must follow the golden rule of one row per record. It sounds deceptively simple, but it’s the single most important principle for making your life in Excel easier.
What's a "record" for a SaaS company? Think of it like this:
- A single subscription event (a new signup, an upgrade, a churn).
- A single transaction or invoice.
- A single customer support ticket logged.
Sticking to this rule puts your data in a "tidy" format, which is exactly what tools like PivotTables and complex formulas need to work their magic. Trying to analyze pre-summarized or poorly structured data is like trying to build a LEGO castle with melted bricks. It’s just not going to work.
I once helped a founder who was spending hours every month manually piecing together MRR from a transaction log. Customer info was scattered across multiple rows for single payments—a total disaster. We rebuilt his export to be one-row-per-transaction. Suddenly, a PivotTable could calculate MRR in seconds, sliceable by plan, channel, or anything else. It saved him nearly a full day of work every single month.
Structuring Your Excel Workbook for Success
A classic rookie mistake is dumping everything—raw data, messy formulas, and the final charts—onto one giant worksheet. That approach gets out of control fast. A much smarter way is to use a multi-tab structure that keeps things clean, separated, and efficient.
Think of it as a clear path from raw numbers to actionable insights.
This structure protects your original data, makes your calculations transparent, and leaves your dashboard as a clean, focused visual layer.
Here’s the playbook I always recommend:
Data_RawTab: This is the vault. Drop your untouched data exports from Stripe, your CRM, or your analytics tool right here. Never, ever touch or calculate anything on this sheet. Its only job is to be the single source of truth.CalculationsTab: This is your workshop. On this sheet, you'll reference theData_Rawtab to build helper columns, run formulas, and stage data for your PivotTables. You're isolating all the messy work from the final presentation.DashboardTab: This is the main stage. This sheet is purely for the visuals—your charts, graphs, and slicers. Every piece of data displayed here should pull from yourCalculationstab or from the PivotTables you built from it.
This separation makes troubleshooting a thousand times easier. If a number looks off on your dashboard, you know the problem is in the Calculations tab. It also keeps your dashboard feeling snappy, since the visual elements aren't weighed down by thousands of rows of raw data.
If you need some inspiration for what the final product can look like, checking out different metrics dashboard examples is a great way to get ideas for layout and design.
Use Excel Tables to Automate Your Data
Here’s one of the best pro-tips for building a low-maintenance dashboard: format your raw data as an official Excel Table. Just click anywhere in your data and hit Ctrl+T. Don't confuse this with just adding borders and colors; Tables are a powerhouse feature.
When your data is in a Table, it becomes dynamic. Add a new row of data at the bottom, and the table automatically expands to include it. This means any chart or PivotTable connected to it updates instantly. You can finally say goodbye to manually adjusting formula ranges from A1:G500 to A1:G650 every time you refresh your data.
If you’re pulling in data from other systems, learning how to export data to Excel from a tool like Airtable is a great starting point. The moment that data lands in your workbook, turn it into an Excel Table. You’ll be building your dashboard on solid ground from the very beginning.
Turning Raw Data into Real Answers with Formulas and PivotTables

Alright, your data is clean and organized. Now for the fun part: building the engine of your dashboard. This is where we stop looking at raw numbers and start creating real, actionable insights.
Forget basic SUM and AVERAGE for a moment. We're diving into the formulas that actually matter to a SaaS operator. These are the workhorses that will transform your static data into a living, breathing story about your business's health.
Think of your Calculations tab as your workshop. It’s where you’ll slice and dice your raw data to calculate churn rates, segment revenue, and track MRR growth—all without ever touching your original data source.
Must-Know Formulas for SaaS Metrics
In SaaS, context is king. A simple user count is almost useless. What you really need to know is how many users from a specific cohort churned in a particular month. This calls for more powerful tools.
Enter SUMIFS and COUNTIFS. These functions are your best friends for this kind of multi-layered analysis, letting you sum or count rows that meet several conditions at once.
COUNTIFSfor Churn: You can instantly find out how many customers who signed up in January (signup_date) and have a 'Cancelled'statusactually churned in March.SUMIFSfor MRR by Plan: Tally up themrrcolumn for all customers where theplan_typeis 'Pro' and thesignup_datewas sometime last quarter.
I once helped a founder who was spending hours manually filtering and counting rows in a massive spreadsheet just to figure out cohort retention. It was a nightmare of potential errors. We replaced that entire mess with a single, dynamic COUNTIFS formula. Not only did it save him a ton of time, but he could suddenly see retention curves for any cohort instantly. He discovered that customers from one specific marketing channel had a 30% higher retention rate—a game-changing insight.
The goal isn't just to calculate a KPI once. It's to build a formula that recalculates it for you, automatically, every single time the data updates. That’s the magic leap from a static report to a truly dynamic dashboard.
Another powerhouse combo is INDEX and MATCH. Think of them as VLOOKUP on steroids—way more flexible and powerful. You can use them to pinpoint the MRR for a specific month or pull the LTV for a customer segment without being stuck with a rigid column order.
For a battle-tested list of the numbers you absolutely should be tracking, check out our complete guide to SaaS KPIs.
Slicing and Dicing with PivotTables
Formulas are perfect for laser-focused calculations, but when you want to explore your data and look for broad trends, nothing beats a PivotTable. This is, without a doubt, Excel's most powerful feature for dashboarding. You can summarize thousands of rows of data with a few clicks—no complex formulas needed.
A PivotTable can answer huge business questions almost instantly. Take your raw transaction data, and in a few seconds, you can create a summary showing:
- Total revenue broken down by customer segment and month.
- The number of new trials, grouped by acquisition channel.
- Average revenue per user (ARPU) across different subscription plans.
This is how you go from just staring at data to actually interacting with it.
Actionable Next Step: Build Your First PivotTable
Let's say you have a data export with columns for customer_id, signup_date, plan_type, and monthly_revenue. You want to see how your revenue is spread across different plans over time.
Instead of writing a dozen SUMIFS formulas, build a PivotTable in under a minute.
- Select your data (which you've smartly formatted as an Excel Table).
- Head to
Insert > PivotTable. - Drag
signup_dateinto the Rows area. Excel is smart enough to group this by months and years for you. - Drag
plan_typeover to the Columns area. - Finally, pull
monthly_revenueinto the Values area.
Boom. You have a perfectly formatted table showing your MRR growth, neatly segmented by subscription plan. A task that could take 30 minutes with formulas is done in less than 30 seconds. This is the kind of efficiency that frees you up to find insights, not just fight with your spreadsheet. Your dashboard kpi excel is now a tool for discovery, not just reporting.
Making Your Dashboard Actually Tell a Story
Numbers are just noise until you give them context. You can have the most precise calculations on the planet, but if they're buried in a messy spreadsheet, they're worthless. A great dashboard KPI in Excel isn't just about data; it's about telling a clear story with smart visuals. It’s what turns a cluttered spreadsheet into a command center for your business.
The real goal here is to build something that anyone—from a product manager to the CEO—can look at and "get" in under 30 seconds. That’s the magic of solid data visualization.
Picking the Right Chart for Each SaaS Metric
Choosing the right chart is half the battle. Get it wrong, and you can accidentally mislead your team. As a SaaS operator, your metrics have very specific stories to tell, and some charts are just built better for the job.
Here’s a quick playbook I stick to:
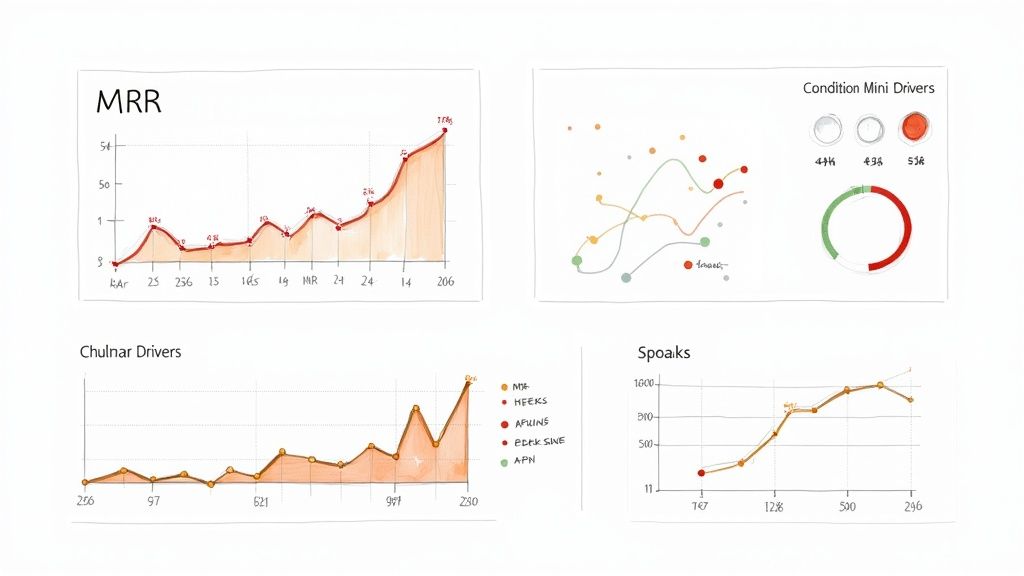
- MRR Growth: A Line Chart is non-negotiable. It's the king of showing trends over time, and nothing communicates momentum better than that upward-sloping line.
- Churn Rate Breakdown: This is a perfect job for a Waterfall Chart. It beautifully illustrates the moving parts of your churn—how many customers you lost from Plan A versus Plan B, and how many you clawed back with reactivation campaigns.
- Revenue by Plan Type: Keep it simple with a Bar Chart or Column Chart. This gives you an instant, easy-to-compare snapshot of which subscription plans are pulling their weight.
- Customer Acquisition Cost (CAC) vs. LTV: Use a Combination Chart (bar and line). This is my go-to for comparing two different metrics on different scales. You can plot CAC as bars for each month and overlay LTV as a line to see if your unit economics are actually making sense.
Actionable Tip: Just avoid pie charts for anything with more than two or three slices. They are notoriously bad for comparing values, and a clean bar chart almost always tells a clearer story.
Simple Design Rules for Maximum Impact
Good news: you don't need a design degree to build an effective dashboard. The best ones focus on function over flash, using a few simple principles to guide the eye and make the data easy to absorb. If you want some inspiration, check out these business intelligence dashboard examples to see these concepts in action.
A few ground rules will completely transform your dashboard's effectiveness:
- Embrace white space: Don't cram every pixel with charts. Giving your visuals room to breathe makes them less intimidating and way easier to read.
- Use a simple color palette: Stick to a few core brand colors. Then, use a single bright, contrasting color (like green for good, red for bad) to make the most important numbers pop.
- Align everything to a grid: A little alignment goes a long way. Keeping your charts and tables neatly lined up instantly creates a sense of order and professionalism.
Making Performance Pop with Conditional Formatting
Conditional formatting is the secret weapon for making a dashboard "talk." Instead of just showing a number, you can instantly show what that number means. It adds a powerful layer of context without creating any clutter.
For instance, you can set up a simple rule to:
- Turn a cell green if your churn rate is below your 3% target.
- Highlight a cell in red if your CAC blows past its threshold.
- Use data bars to create mini in-cell bar charts that show performance relative to a goal at a glance.
This is especially powerful when you integrate it into a scorecard format in Excel. You can instantly see which metrics are on track and which ones need your immediate attention. We actually have a full guide on building a great scorecard format in Excel right here.
Another fantastic tool is Sparklines. These are tiny, in-cell charts that show a trend without taking up any real estate. You can pop a Sparkline right next to your MRR number to show its trajectory over the last six months. It's an elegant way to pack more story into less space, making your dashboard both powerful and scannable.
Stop Wasting Hours on Manual Updates—Let's Automate Your Dashboard
A great dashboard is a thing of beauty, but if you're manually updating it every week, it's really just a time-consuming report. The real magic happens when your dashboard kpi excel updates itself, freeing you from the soul-crushing cycle of copy-pasting new data. We’re not just talking about saving a few minutes here and there; we’re talking about turning a static picture into a live, dynamic tool that spits out fresh insights on demand.
The whole point is to kill the manual grunt work. Imagine your Stripe transaction data flowing right into your dashboard, with your MRR and Churn metrics recalculating on their own. This is how you make your dashboard work for you, not the other way around.
Meet Your New Best Friend: Power Query
If you're still wrestling with messy CSV exports by hand, let me introduce you to Power Query. It’s a free tool already built into modern versions of Excel (look under the 'Data' tab for 'Get & Transform Data'), and honestly, it’s a total game-changer for this kind of work.
Think of Power Query as a macro recorder for your data prep. You can hook it up directly to a source—like a folder where you drop your daily CRM exports. Then, you record a series of steps to clean and transform that data just once. You can tell it to remove certain columns, split text, or reformat dates.
From then on, all you ever have to do is hit "Refresh." Power Query runs through every single one of those steps on the new data, perfectly, every single time. It's brilliant.
A Simple Data Refresh Setup
Here’s a classic scenario for anyone in SaaS: you download a weekly transaction report from Stripe. The old way involved spending 20 minutes deleting columns, fixing dates, and cleaning up text just to get it ready for a PivotTable.
With Power Query, you do the work one time:
- Connect Your Source: Point Power Query to the folder where you save your Stripe exports.
- Record Your Cleanup Steps: Do all your usual data-cleaning moves inside the Power Query editor. Every click is saved as a repeatable step in a "query."
- Load the Clean Data: Push the clean, ready-to-use data into an Excel Table on your
Data_Rawsheet.
Now, next week, you just drop the new Stripe file into that same folder and click the "Refresh All" button in Excel. Boom. Your entire dashboard updates instantly. This is probably one of the most powerful things you can master when figuring out how to automate repetitive tasks and get your time back for work that actually matters.
A dashboard that isn’t automated is a report. A dashboard that updates itself is an analysis tool. The difference is in the time you spend maintaining it versus the time you spend using it to make decisions.
Make Your Dashboard Interactive with Slicers
Automation gets the fresh data in, but interactivity is what makes your dashboard truly useful for the rest of your team. That's where Slicers come into play. Slicers are basically fancy, user-friendly filter buttons that you can connect to your PivotTables and charts.
Instead of digging into a PivotTable's filter dropdowns, you can create a Slicer for any important data point.
- Want to isolate performance for your "Enterprise" plan? Just click the 'Enterprise' button on the Plan Type slicer.
- Need to drill down into a specific marketing channel? Click it on the Channel slicer.
The best part is, when you click a slicer, every chart and table connected to that data source instantly filters. This turns a static report into a live analysis tool that anyone can use in a meeting to explore trends and answer questions on the fly. You can also use Timelines, a special kind of slicer made just for dates, to let people filter the whole dashboard to a specific month or quarter with a simple click and drag.
Got Questions About Building Your SaaS Dashboard in Excel?
Even with the best instructions, you're bound to hit a few snags when building a dashboard for the first time. I've seen SaaS operators bump into the same questions over and over, so let's get them out of the way right now.
Can Excel Actually Handle Big SaaS Data Sets?
Yes, it absolutely can—you just have to use the right tools within Excel. If you're working with under 100,000 rows of data, standard formulas and PivotTables will get the job done without much fuss.
But what happens when you're dealing with millions of rows of user event data or transaction logs? That's when you need to bring in the big guns: Power Pivot.
Power Pivot is Excel's built-in data modeling engine, and it’s a game-changer. It compresses massive amounts of data and lets you run calculations lightning-fast. The trick is to use Power Query to pull your data directly into the Power Pivot "Data Model," bypassing the regular spreadsheet grid entirely. This keeps your file from bloating and ensures your dashboard stays snappy and responsive.
How Often Should I Be Updating This Thing?
There’s no magic number here. The right update schedule completely depends on who's using the dashboard and what decisions they need to make.
Think of it this way—align the refresh frequency with the team's "decision cycle":
- Frontline Teams: Your sales or support teams are in the trenches every day. They need to see leading indicators like new trial signups or support ticket volume updated daily or at least weekly to make quick, tactical adjustments.
- Leadership & Investors: This group is focused on the bigger picture. They’re tracking lagging indicators like MRR Growth, LTV, or Churn Rate. A weekly or monthly update gives them the strategic view they need without getting bogged down in daily noise.
My advice? Automate the data refresh with Power Query so the numbers are always ready. Then, set up a strict meeting rhythm for different teams to actually review the dashboard and decide what to do next.
I once worked with a founder who was obsessed with daily MRR updates. The team was constantly reacting to tiny, meaningless fluctuations. We moved them to a weekly dashboard review, and suddenly, their strategic conversations became ten times more productive.
What's the Single Biggest Mistake People Make?
Easy. They cram their dashboard with way too many vanity metrics.
I've seen dashboards with 30+ different charts and numbers. That isn't a tool for focus; it's a recipe for analysis paralysis. A cluttered dashboard distracts your team and makes it impossible to see what actually matters for growth at your current stage.
A truly great dashboard KPI excel file tells a clear story with just 5-7 core metrics. Start by figuring out your "One Metric That Matters" (OMTM) right now. For an early-stage SaaS, that might be your trial-to-paid conversion rate. Then, pick a few supporting KPIs that directly push that main number. Always choose focus over quantity.
Should I Just Use a Template or Build It Myself?
Templates are great for getting ideas. They can show you what’s possible with different layouts, chart types, and designs. But I’m a huge believer that every operator should build their own dashboard from scratch at least once.
Why? Because the process forces you to really dig in and understand your own data. You have to think critically about which metrics are truly important for your specific business model, whether it’s usage-based, seat-based, or something in between.
So, look at templates for inspiration, but build the tool yourself. It's the only way to create something that perfectly fits your business and actually helps you make better decisions.
At SaaS Operations, we build battle-tested playbooks and templates to help operators like you build smarter, more efficient businesses. Our frameworks are all about saving you time and helping you grow faster. Learn more and access our proven resources at saasoperations.com.