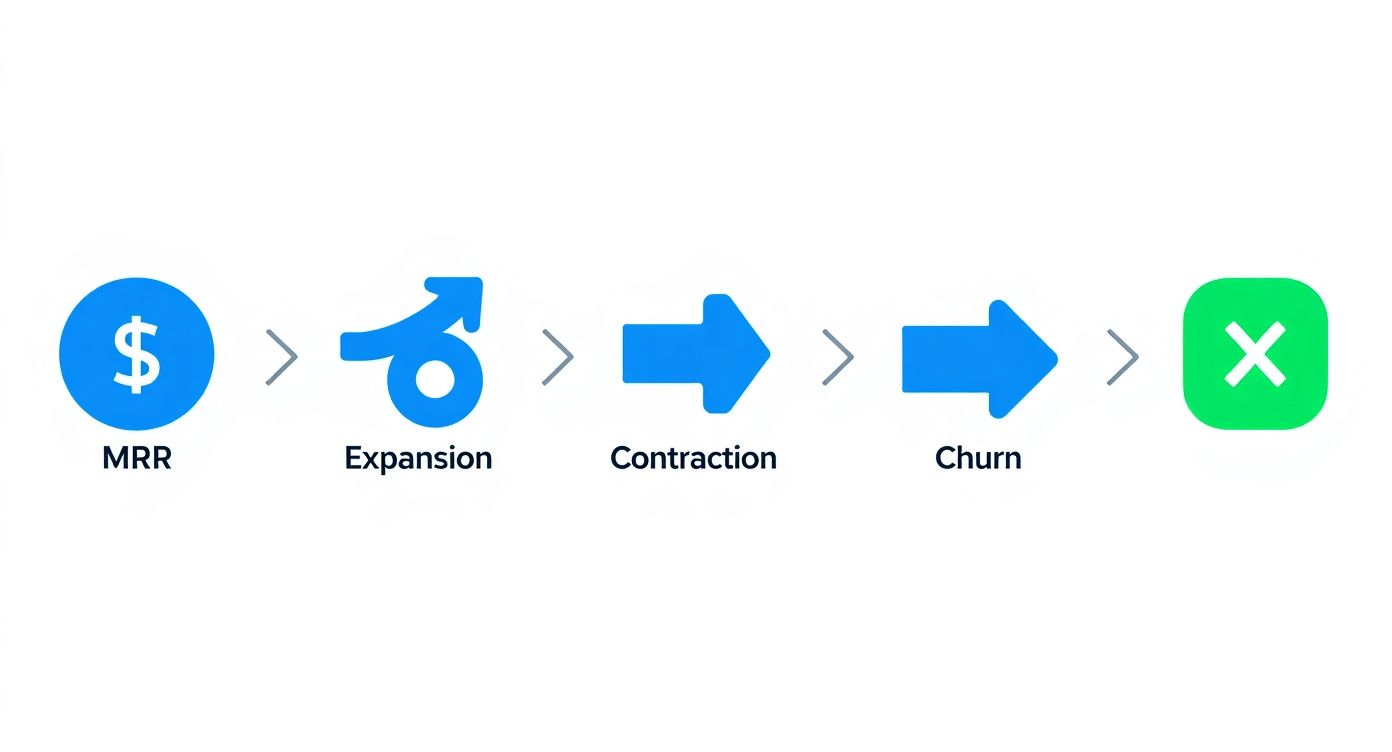
Let's stop guessing about your business's health. Too many SaaS founders get hung up on vanity metrics like sign-ups or traffic. The real operators? They're obsessed with the core engine of their growth: Net Revenue Retention (NRR).
This isn't just another acronym. NRR is arguably the single most important indicator of sustainable, profitable growth. Why? Because it tells you how effective you are at keeping and growing the revenue you already have.
If your NRR is over 100%, it means your business is expanding even if you don't land a single new customer. That’s the ultimate proof that you’ve built something valuable and sticky, and it’s the number investors will zero in on first.
Your Free NRR Calculator and How to Use It
Before you can punch numbers into a calculator, you need to know what you're looking for. The good news is, you only need four key pieces of data from your customer base over a specific period—usually a month or a quarter. The fastest way to get your number is to use our NRR calculator, but understanding the components is key.
The Four Pillars of NRR
To get a clear picture, you'll need to pull these four numbers together. They're the building blocks of your entire NRR calculation.
- Starting MRR: This is your Monthly Recurring Revenue from a specific group of customers at the very beginning of the period you're measuring.
- Expansion MRR: All the new cash you brought in from that same group of customers. Think upsells, cross-sells, or add-ons. They liked your product so much they paid you more for it.
- Contraction MRR: The opposite of expansion. This is the revenue you lost from that group because they downgraded or switched to a cheaper plan.
- Churned MRR: This one hurts the most. It's the total MRR you lost from customers in that group who canceled their subscriptions and walked away entirely.
This quick-glance table breaks down what each piece of the puzzle represents.
NRR Components at a Glance
| Metric | What It Measures | Example |
|---|---|---|
| Starting MRR | Your revenue baseline from a customer cohort. | $100,000 in MRR on January 1st. |
| Expansion MRR | Growth from existing customers via upsells/add-ons. | $10,000 from customers upgrading plans. |
| Contraction MRR | Revenue loss from existing customers downgrading. | $3,000 from customers on a lower tier. |
| Churned MRR | Total revenue lost from customers who canceled. | $5,000 from customers leaving for good. |
Once you have these numbers, you’re ready to see where you stand.
The whole process is pretty straightforward. You start with your base revenue, add the good stuff (expansions), and then subtract the bad stuff (contractions and churn).
The infographic really simplifies it: your starting revenue gets a boost from expansions but takes a hit from both downgrades and cancellations. The final number tells the story.
Got your numbers handy? Just plug them into our free NRR calculator for an instant result. If you're more of a spreadsheet person, you can get under the hood and build your own SaaS KPI dashboard in Excel.
NRR is More Than Just a Metric
Thinking about NRR is really about thinking about momentum. Funnily enough, demographers use an almost identical concept called the Net Reproduction Rate to see if a population is growing or shrinking. An NRR of exactly 1 in that world means the population is perfectly replacing itself.
For a SaaS business, an NRR of 100% is that break-even point. Anything less, and you're leaking revenue from your existing customer base—a major red flag.
The real magic happens when your NRR climbs above 100%. This is what separates good SaaS companies from great ones. It proves your customer success team is crushing it, your pricing is built for growth, and your product delivers more value over time.
If you only have time to track one metric, make it NRR. It forces you to focus on retention and expansion, which are always cheaper and more predictable ways to grow than constantly chasing new logos. Get this right, and you'll be on a clear path to building a much stronger, more valuable company.
Let's Calculate NRR with a Real SaaS Example
Formulas are great, but they don't click until you see them work with actual numbers. Let's walk through a realistic scenario for a fictional SaaS company, 'ConnectSphere'—a project management tool.
Seeing their numbers in action will show you how all the moving parts of Net Revenue Retention fit together. More importantly, you'll see how one percentage point can tell a massive story about the health of a business and what actions you need to take next.
Scenario 1: ConnectSphere’s Healthy Growth
Picture this: it's the beginning of Q2, and the team at ConnectSphere wants to calculate their NRR for the previous quarter (January 1st to March 31st). They pull the numbers for the group of customers they had on day one of Q1.
Here’s what they found:
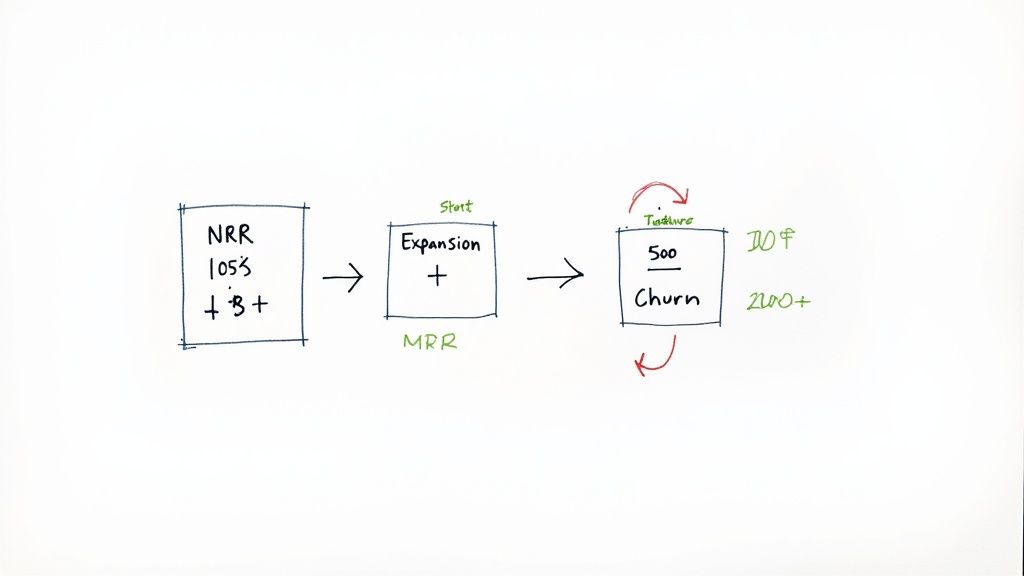
- Starting MRR: $50,000
- Expansion MRR: $8,000 (This came from existing customers upgrading to higher-tier plans and adding more seats. A great sign!)
- Contraction MRR: $2,000 (A few customers downgraded their plans, which happens.)
- Churned MRR: $3,500 (These are the customers who canceled their subscriptions entirely.)
With these four key figures, we have everything we need. You could just pop them into our NRR calculator, but let's do the math by hand to really understand what's going on under the hood.
The formula is: [(Starting MRR + Expansion MRR - Contraction MRR - Churned MRR) / Starting MRR] * 100
Plugging in ConnectSphere's numbers, we get:
[($50,000 + $8,000 - $2,000 - $3,500) / $50,000] * 100
Which simplifies down to:
[($52,500) / $50,000] * 100 = 1.05 * 100 = 105%
ConnectSphere's NRR for Q1 is a solid 105%. This is fantastic. It means that for every dollar they started the quarter with, they ended up with $1.05 from that same exact group of customers. The revenue they gained from happy, growing customers more than made up for the losses from downgrades and churn.
Scenario 2: A Warning Sign for ConnectSphere
Now, let's jump ahead to the next quarter. Q2 was tougher for the team. A competitor launched a flashy new feature, and a few of ConnectSphere’s key accounts had to deal with budget cuts, leading to more downgrades and cancellations.
Here are the numbers for the customer cohort that existed at the start of Q2 (April 1st):
- Starting MRR: $55,000 (Let's assume they added some new customers in Q1, so the base is bigger.)
- Expansion MRR: $4,000 (Upsells slowed way down.)
- Contraction MRR: $3,000 (More customers moved to cheaper plans.)
- Churned MRR: $7,000 (They lost a couple of their larger accounts, which always stings.)
Let’s run the calculation again with these new figures:
[($55,000 + $4,000 - $3,000 - $7,000) / $55,000] * 100
This simplifies to:
[($49,000) / $55,000] * 100 = 0.89 * 100 = 89%
Ouch. ConnectSphere's NRR for Q2 is 89%. This is a major red flag.
An NRR below 100% means your business is shrinking from the inside out. Your existing customer base is becoming less valuable over time, forcing you to acquire new customers just to stay afloat. It's the classic "leaky bucket"—you're furiously pouring new revenue in the top while your existing revenue is draining out the bottom.
This drop from 105% to 89% in a single quarter signals an urgent problem that needs attention. It’s not just a bad number; it's a negative trend. The next step isn't just to calculate NRR again in Q3; it's to dig in and find out why this is happening.
Interpreting the Results and Taking Action
Seeing these two scenarios side-by-side highlights how NRR acts as an early warning system. An operator at ConnectSphere would need to immediately start asking some tough questions:
- Why did our expansion revenue get cut in half? Are our Customer Success Managers missing upsell opportunities? Is the value proposition of our higher-tier plans not compelling enough?
- Why did our churn double? Are customers leaving for that new competitor? Did we have a critical product bug or a slip-up in our support quality?
- What's behind the increase in downgrades? Is our pricing suddenly out of line with the market, or are customers just not using the features they're paying for?
The NRR calculation is the starting pistol, not the finish line. It tells you that a problem exists. Your job as an operator is to use that signal to investigate the why. High churn is almost always the main culprit behind poor NRR, so understanding its root causes is crucial. If you're struggling here, you can get a more detailed look by using our free churn rate calculator.
By tracking NRR regularly, you can spot these kinds of negative trends early and jump in before a leaky bucket becomes a flood. That's why mastering this one simple calculation is one of the most powerful things you can do for your SaaS business.
Interpreting Your NRR Score: Good, Great, and Elite
Alright, you've run the numbers and have your NRR percentage. Now what? That percentage tells a rich story about your product's stickiness, your customers' happiness, and your company's future.
Putting that score into context is the difference between having raw data and having a strategic compass. Not all NRR scores are created equal, and the gap between "good" and "elite" can mean a massive difference in your company's valuation.
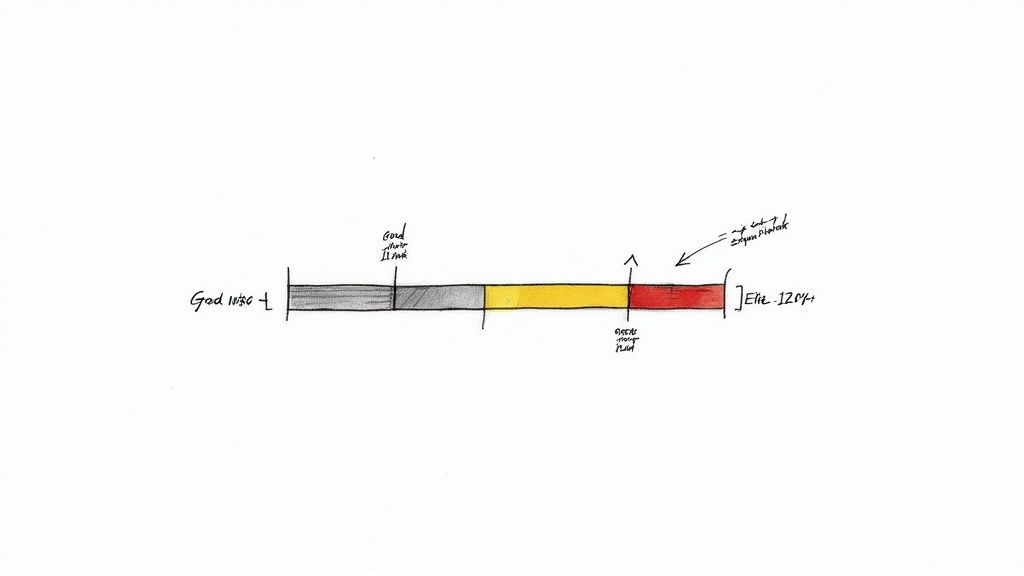
So, What's a "Good" NRR Score?
Let's cut right to the chase. As a SaaS operator, you need benchmarks. Here’s a breakdown of what your NRR percentage means in the wild.
-
Below 100% (The Leaky Bucket): This is a serious red flag. An NRR under 100% means you're losing more revenue from existing customers (through churn and downgrades) than you're gaining from them (through upgrades and cross-sells). You're effectively in a constant, expensive fight to acquire new customers just to tread water.
-
100% – 110% (Good and Healthy): Hitting this range is a solid place to be. It means your expansion revenue from happy customers is canceling out your churn. You've built a stable foundation that allows for capital-efficient growth. Most successful B2B SaaS companies live comfortably in this zone.
-
110% – 120% (Great Performance): Now we're talking. A score in this territory shows you have strong product-market fit. Your customers aren't just sticking around; they're actively finding more value and spending more over time. This is a sign of a powerful growth engine humming along within your existing user base.
-
120%+ (Truly Elite): Welcome to the big leagues. This is the hallmark of hyper-growth, top-tier SaaS companies. An NRR this high signals that your product is indispensable, and your expansion strategy is world-class. It’s a massive green light for investors.
Why Investors Obsess Over High NRR
Venture capitalists are laser-focused on this metric for one simple reason: it predicts future revenue with incredible accuracy. A high NRR demonstrates a powerful, efficient growth model.
Just look at a company like Snowflake, which famously posted NRR figures well over 150% before its IPO.
Think about that for a second. An NRR that high tells investors a wild story: even if Snowflake completely stopped signing new customers, the company would still grow by over 50% every single year, purely from its existing base. That's the dream.
This is exactly why a company with $10M in revenue and 120% NRR is often valued much higher than one with $12M in revenue and 95% NRR. One is on an exponential curve powered by its own customers; the other is fighting an uphill battle against churn.
Using Your NRR as a Diagnostic Tool
Your NRR isn't just a grade for your report card; it’s a powerful diagnostic tool. Once you have the number, the real work begins. You have to ask why.
A low or declining NRR is never just a "retention problem"—it’s a symptom of something deeper. Your job is to play detective and uncover the root cause. For a deeper dive, our complete guide on the net retention rate covers these nuances in more detail.
Here's where to start digging:
- Is it a Product Problem? Are customers leaving because the product is buggy, missing features they need, or just not delivering on its promise? Dive into your support tickets and product usage analytics.
- Is it a Customer Success Gap? Maybe your onboarding is weak, leaving users confused. Or perhaps your CSMs are reactive instead of proactively showing customers how to unlock more value. This kind of churn is often preventable.
- Is it a Pricing or Packaging Issue? Is your pricing misaligned with the value you deliver? Are there no obvious or compelling upgrade paths? Smart pricing should naturally encourage expansion as a customer's business grows with you.
Your NRR score isn’t the end of the story—it’s the beginning of a crucial conversation about your business. A good next step is to look beyond NRR and check out a broader guide to user retention metrics to get a more holistic view. Use your NRR to pinpoint weaknesses, double down on what’s working, and build a more resilient, efficient SaaS engine.
Actionable Playbooks to Improve Your NRR
Calculating your Net Revenue Retention is the easy part, especially when you have a handy NRR calculator free to do the heavy lifting for you. The real challenge—and where the magic happens—is figuring out how to actually improve that number. A great NRR doesn't just materialize out of thin air; it’s the direct result of a smart, deliberate strategy.
This isn't about crossing your fingers and hoping for the best. It’s about putting proven playbooks into action that turn NRR from a metric you simply track into a result you actively build. Let's walk through three core strategies that the best SaaS operators are using right now to drive expansion, lock in retention, and grow a much healthier business.
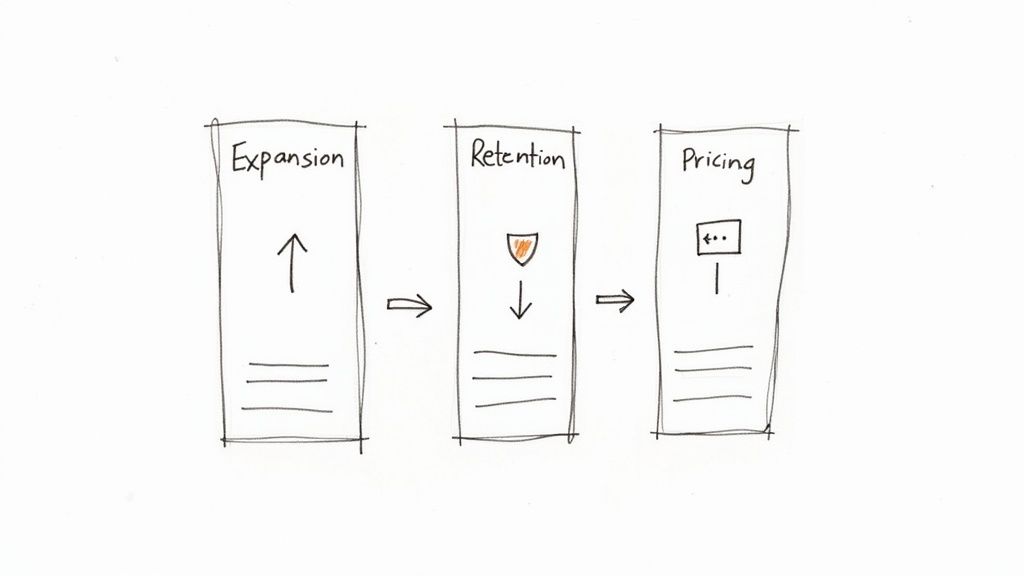
The Expansion Revenue Playbook
Your happiest, most engaged customers are your single biggest growth opportunity. They already get your product, they trust your brand, and they're seeing value. The Expansion Playbook is all about creating a system to find and capture this low-hanging fruit.
The goal here is to stop treating upsells like random acts of good fortune and start engineering them. It all starts with pinpointing the right triggers—the signals that an account is ready and primed for an upgrade.
A few key tactics to put in place:
- Monitor Usage Limits: This one is a classic for a reason. Set up automated alerts for accounts getting close to their plan limits, whether it's user seats, contacts, or data storage. It's the clearest sign that a customer is pushing the boundaries of their current plan and is ready for more.
- Track "Pro" Feature Clicks: Start logging every time a user on a lower-tier plan clicks on a feature or menu item that’s reserved for a higher tier. This is a direct, behavioral expression of interest. Your customer success manager (CSM) can then jump in with a perfectly timed, targeted demo or trial offer.
- Celebrate Customer Wins: Did your client just close a huge deal using your CRM or launch a massive campaign with your marketing tool? That’s the perfect time to reach out and introduce how your premium features can help them scale that success even further.
The core idea is simple: stop selling and start solving. An expansion conversation should never feel like a pushy sales call. It should feel like a proactive, helpful consultation that shows the customer a clear path to getting even more value from your platform.
The Proactive Retention Playbook
You simply can't have a stellar NRR without world-class retention. The most effective way to keep your customers is to solve their problems before they even think about looking elsewhere. This playbook is all about shifting your customer success team from a reactive, "firefighting" mode to a proactive, data-driven one.
First, you need to understand why people leave. A guide to AI-powered churn rate analysis can give you incredible insight into the root causes. Once you know the "why," you can build a system to get ahead of the problem.
This usually involves creating a "customer health score" based on a few crucial metrics:
- Product Adoption Rate: Are they actually using the core, sticky features of your product? Low adoption is often the earliest warning sign of churn.
- Support Ticket Volume: A sudden spike in support tickets can signal deep frustration. On the flip side, complete radio silence can be just as bad—it might mean they've already mentally checked out.
- Key User Activity: Has the main admin or power user—your internal champion—stopped logging in? This is a massive red flag.
By tracking these data points, you can flag at-risk accounts automatically. This lets your CSMs intervene with targeted help, extra training, or strategic advice long before the customer even starts looking at your competitors. For a much deeper dive, we have a whole guide on building out a customer success playbook you can steal and implement right away.
The Strategic Pricing Playbook
Sometimes, the most powerful lever you can pull to improve NRR isn't in your sales or success department—it's on your pricing page. Your pricing model should be a growth engine, not just a static menu. The real goal is to tightly align the price a customer pays with the value they receive, creating a natural runway for expansion.
Plenty of SaaS companies start with simple "good, better, best" tiers, and that's fine. But the most successful operators eventually evolve their pricing to actively encourage account growth.
Think about incorporating these approaches:
- Value-Metric Pricing: Instead of just charging per user, tie your pricing to a metric that grows as your customer's business succeeds. For an email platform, this could be the number of subscribers. For a video hosting service, maybe it's bandwidth. As they grow, you grow with them. It’s automatic expansion.
- Smart Feature Gating: Don't just randomly toss features into your higher-tier plans. Be strategic. Place the features that solve bigger, more complex team-level problems in your premium packages. A "basic" plan might solve a problem for one person, while the "pro" plan solves it for a whole department with things like advanced permissions and collaboration tools.
- Add-On Modules: Consider unbundling specific, high-value features and offering them as optional add-ons. This is a great way to capture expansion revenue from customers who aren't quite ready for a full plan upgrade but need to solve one specific, urgent problem right now.
When you thoughtfully design your pricing and packaging, you create a frictionless path for customers to spend more as they get more successful. This makes expansion a natural byproduct of the value you deliver, turning your pricing strategy into one of your most effective NRR drivers.
Common NRR Mistakes Most Founders Make
https://www.youtube.com/embed/iV39VqpW6no
SaaS revenue can get messy. It's shockingly easy to miscalculate your Net Revenue Retention, and I've seen countless operators make small errors that lead to bad data—and even worse, bad strategic decisions. Getting this right is what separates amateurs from the pros who build their growth on a foundation of accurate, reliable data.
The most common error is also the most fundamental: accidentally including new business MRR. I can't stress this enough. Your NRR calculation must only include the cohort of customers that existed at the start of the period. New customers are absolutely vital for growth, of course, but they have no place in a retention metric.
Another classic mistake is forgetting to subtract all the negative components. It sounds obvious, but in the rush to tally up exciting expansion wins, founders sometimes overlook the full impact of downgrades and churn. Every single dollar of contraction MRR has to come out of the equation.
Handling Tricky Revenue Scenarios
Beyond the basics, a few specific situations always seem to trip people up. Knowing how to handle these edge cases is what keeps your data clean and trustworthy.
Here’s a quick rundown of how to deal with the most common ones:
- Annual Contracts: If a customer pays upfront for the year, you still need to normalize their contract value into MRR. A $12,000 annual deal is treated as $1,000 in MRR for your calculation. Whatever you do, don't dump the entire contract value into a single month.
- Mid-Month Upgrades: Prorate it. Let's say a customer upgrades from $100/month to $200/month halfway through the month. You should only count $50 of expansion MRR for that specific month's calculation.
- Service Credits or Discounts: These should always be treated as contraction. If you give a $200 credit to a customer to make them happy, that's $200 less revenue you retained from them in that period.
The golden rule for one-time fees is simple: leave them out. NRR is all about recurring revenue. Implementation fees, training costs, or any professional service charges are not part of the core subscription and will absolutely skew your numbers if you include them.
The Danger of Inconsistent Time Periods
Calculating NRR over inconsistent or poorly defined periods is another major pitfall I see. Sure, comparing a 30-day month to a 31-day month might introduce some minor noise, but the real danger lies in comparing a monthly calculation to a quarterly one without any context. Always use consistent timeframes—monthly, quarterly, or annually—if you want to do any meaningful trend analysis.
Interestingly, the concept of NRR isn't unique to SaaS. The demographic metric of the same name, Net Reproductive Rate, also relies on precise formulas to gauge population trends. Demographers often use a free online NRR calculator to determine if a population is growing, where NRR = ((Births – Deaths) / Total Population) * 100. For instance, in a population of 100,000, 5,000 births and 3,000 deaths result in an NRR of 2.00%. You can learn more about how these demographic tools work and see the formulas in action by exploring resources dedicated to population studies.
Mastering these details ensures your data is clean. And clean data prevents you from overreacting or underreacting to what you think are changes in customer health. Understanding the nuance is especially important when you start digging into why customers are leaving, which is a critical step in improving NRR. For a deeper look into this, check out our guide on understanding churn in SaaS.
Your Top NRR Questions, Answered
Alright, let's tackle some of the common questions I hear from SaaS founders about Net Revenue Retention. No fluff here, just straight answers to help you get the most out of this metric and sidestep the usual pitfalls.
What's a Good NRR for B2B SaaS?
While the "right" number can shift depending on your market, a good benchmark for B2B SaaS is anything north of 100%. Hitting that mark means the revenue growth from your existing customers is more than making up for any losses from churn or downgrades.
Here’s a quick breakdown of what the numbers generally mean:
- 100-110%: You're in a solid, healthy spot.
- 110-120%: This is great territory, a strong signal of product-market fit.
- 120%+: Now you're in elite company. This indicates you have a seriously powerful expansion engine built into your business.
When you see companies with an NRR this high, you're looking at a business that can almost grow on its own, even without signing a single new customer.
How Often Should I Be Calculating This?
Most SaaS operators I know track NRR both monthly and quarterly, and for good reason. Each cadence tells you something different.
Monthly calculations help you spot trends in near real-time. If there's a sudden dip, you'll know right away and can start digging in. On the other hand, quarterly and annual views smooth out the monthly bumps, giving you a more stable, big-picture perspective on the health of your customer base. A good NRR calculator free of charge (like the one we built) makes running these numbers a breeze, no matter the timeframe.
The most important thing is consistency. Pick your reporting periods and stick to them. That’s how you build a reliable historical view of your momentum and customer health.
Is it Even Possible to Have an NRR Over 100%?
Absolutely! In fact, an NRR over 100% should be the goal for pretty much any SaaS business. It’s the clearest sign that your expansion revenue—the money from upsells, cross-sells, and add-ons—is outweighing the revenue you're losing from churned customers and downgrades.
This amazing situation has a name: "negative churn." It’s the ultimate proof that your product is sticky and that your customers are finding more and more value in it over time. It makes your growth incredibly efficient and way more sustainable in the long run.
Ready to stop guessing and start growing? Get instant clarity on your most important metric with the SaaS Operations NRR calculator free to use on our website.