SaaS churn rate is the percentage of customers or revenue you lose over a specific period. It's the ultimate health check for any subscription business because it tells you, point-blank, how well you're retaining customers and delivering on your value promise.
Think of it as the classic leaky bucket. If you're losing customers (water) faster than you can pour new ones in, your growth efforts will eventually amount to just treading water. To scale, you must plug the leaks.
Why Your SaaS Churn Rate Is the Only Metric That Matters
Let's be real—churn is the silent killer that slowly eats away at your Monthly Recurring Revenue (MRR) and quietly invalidates all the hard work you’re pouring into customer acquisition.
Sure, vanity metrics like website traffic and new sign-ups provide a nice dopamine hit. But your saas churn rate is the final verdict from your customers on your product's real-world value and your company's long-term viability.
Ignoring churn is a fatal mistake for any operator because it traps you in an expensive, exhausting cycle of acquiring new customers just to stand still. Your Customer Acquisition Cost (CAC) skyrockets while your Lifetime Value (LTV) plummets.
The Two Sides of Churn
It’s critical to remember that not all churn is the same. Smart operators track two different kinds to get the full story on their business's health.
- Customer Churn: This one's straightforward. It’s the percentage of customers who cancel their subscriptions. It answers the simple question: "How many logos did we lose?"
- Revenue Churn (MRR Churn): This metric is arguably more important. It tracks the percentage of revenue lost from those cancellations. This gives you the true financial impact, because losing one enterprise client paying $5,000/month hurts a whole lot more than losing ten small businesses paying $20/month.
This distinction is everything. High customer churn is a problem, but high revenue churn can bring your business to its knees. Getting a handle on both is a fundamental part of mastering your key metrics. You can dig deeper into which metrics matter most in our complete guide to SaaS KPIs.
The Ultimate Goal: Net Negative Churn
The SaaS companies that truly dominate are obsessed with one thing: Net Negative Churn. This is the holy grail. It happens when the new revenue you gain from your existing customers (think upgrades, add-ons, and expansions) is greater than the revenue you lose from the customers who cancel.
When you hit net negative churn, your company grows on its own, even if you don't sign a single new customer. It becomes a powerful, built-in growth engine fueled entirely by your customers' success.
Recent data pegs the average churn rate for B2B SaaS companies at around 3.5%, which includes both voluntary churn (customers actively canceling) and involuntary churn (like failed payments). This number can swing a lot depending on your company's stage and who you sell to—enterprise customers tend to stick around longer than SMBs. If you want to see how you stack up, check out these SaaS churn benchmarks on Vitally.io.
Knowing where you stand is the first step. Then you can start building a business that's truly built to last.
How to Calculate Churn Rate Without Lying to Yourself
Let's be honest, looking at your churn numbers can feel like staring into the abyss. But it's the only way to get a real, unfiltered look at the health of your business. Calculating your SaaS churn rate isn't about getting lost in complex spreadsheets; it's about getting a clear signal from your customers.
Forget the confusing jargon. We're going straight to the simple formulas that actually matter.
First up is the most fundamental metric: Customer Churn Rate. This tells you, in plain terms, what percentage of your customers bailed on you over a certain period.
The formula is as straightforward as it gets:(Customers Lost in Period / Customers at Start of Period) x 100 = Customer Churn Rate
So, if you kicked off May with 1,000 customers and 50 decided to cancel, your customer churn rate for that month is 5%. It's a quick, top-level pulse check on how many logos are walking out the door.
Measuring the Real Financial Damage
While knowing your customer count is useful, MRR Churn (or Revenue Churn) is where the real story is told. This metric tracks the percentage of monthly recurring revenue you've lost, which shines a much brighter light on the financial impact. After all, losing one massive enterprise customer can hurt a lot more than losing 20 small accounts.
Here’s how you calculate it:(MRR Lost from Churned Customers in Period / MRR at Start of Period) x 100 = MRR Churn Rate
Let's stick with our example. If you started May with $100,000 in MRR and those canceled accounts took $7,000 with them, your MRR churn rate is 7%. This number shows you where your business is truly bleeding, even if the customer churn number seemed manageable.
If you want an easy way to run these numbers without fiddling with spreadsheets, you can use our simple churn rate calculator for free.
This chart breaks down the usual suspects behind churn, showing how both voluntary and involuntary cancellations add up.
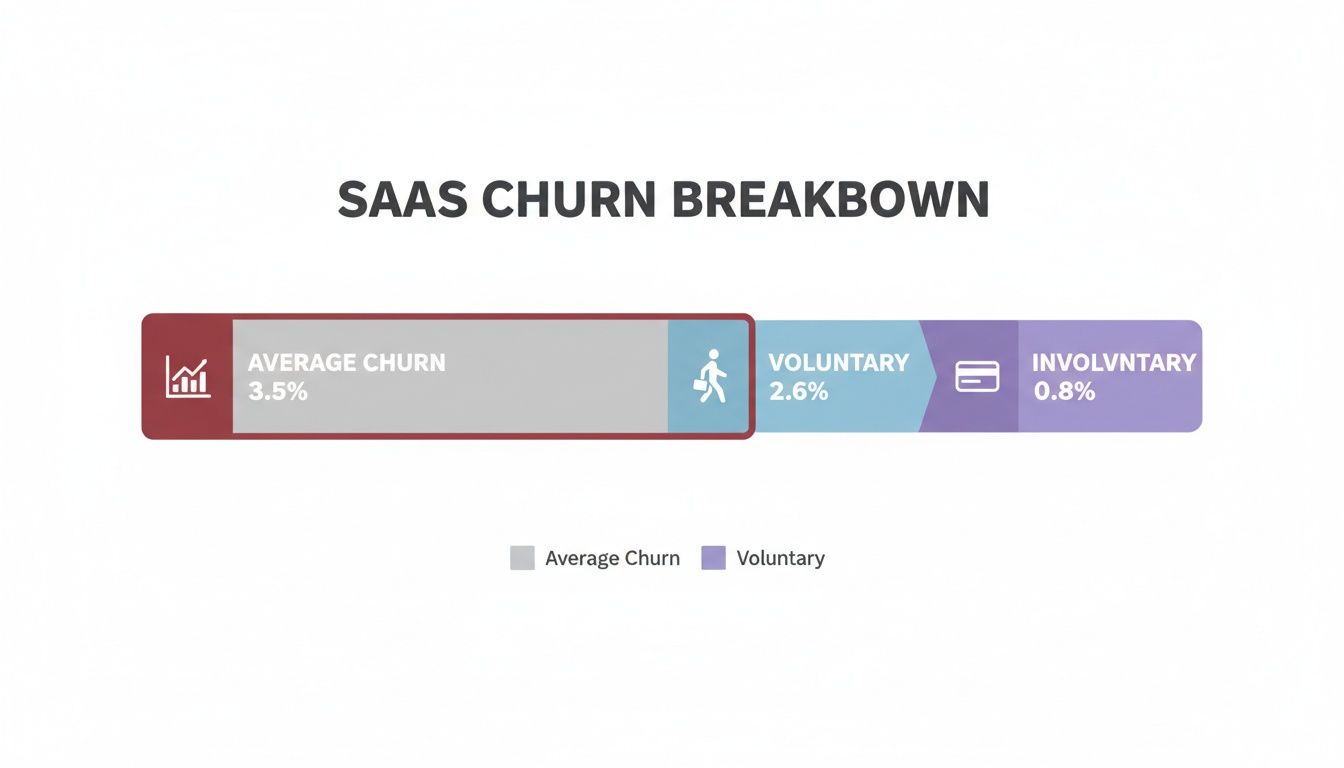
As you can see, voluntary churn—customers actively choosing to leave—is typically a much bigger piece of the puzzle than involuntary churn from things like failed payments.
The Problem with Simple Monthly Churn
Now for the critical part: relying solely on a single, monthly churn rate is dangerous. That one number can easily lie to you. A huge marketing push one month might bring in a flood of new users, temporarily masking a serious retention problem that bites you the next.
A single monthly churn rate is just a snapshot in time. It tells you what happened, but it can’t tell you why or when the problem really started.
This is the point where you have to stop being a number-cruncher and start being a data detective. You need to look at how customers behave over time to find the patterns that reveal the true health of your company.
Uncovering the Truth with Cohort Analysis
The secret weapon for an honest churn analysis is cohort analysis. A "cohort" is just a fancy word for a group of customers who all signed up around the same time—usually within the same month. By tracking each of these groups over their entire lifecycle, you can see exactly when people are dropping off and start to understand why.
Picture a cohort table. Each row is a different signup month (the "January 2024 Cohort," for example), and the columns track the months since they signed up (Month 1, Month 2, Month 3, and so on). Inside the table, you see the percentage of each group that's still sticking around.
This approach lets you answer the questions that actually matter:
- Did that new onboarding flow we launched in March actually work? Just compare the March cohort's retention in Month 3 to the February cohort's. The answer will be right there.
- Did our price hike in June cause a mass exodus? You'll see it immediately in the churn rates for all your active cohorts right after the change.
- Is our product getting stickier over time? If you're making the right improvements, your newer cohorts should retain better than your older ones.
Cohort analysis is what connects your churn numbers back to your business decisions. It transforms a vague, scary metric into a powerful diagnostic tool, helping you pinpoint exactly what’s working—and what’s breaking—in your customer journey.
So, you’ve run the numbers and now you're staring at your churn rate. The big question on your mind is probably, "Is this good or bad?"
The honest, and perhaps slightly frustrating, answer is: it depends entirely on your business.
There isn't a single magic number that defines a "good" SaaS churn rate. A 5% monthly churn might be totally fine for a low-cost, product-led tool that freelancers can pick up and drop easily. But for a high-touch enterprise SaaS with six-figure contracts and year-long sales cycles? That same 5% monthly churn would be a full-blown, five-alarm fire.
The trick is to stop chasing generic industry averages and start benchmarking against companies that actually look and feel like yours. Context is everything.
Finding Benchmarks That Actually Matter
To set a realistic target, you have to filter the noise and focus on the variables that define your business model. The three most important factors are who you sell to, your company's stage of growth, and your average price point.
Think about your target customer:
- Small to Medium-Sized Businesses (SMBs): These customers tend to be more sensitive to price and have fewer hoops to jump through if they want to switch to a competitor. For SaaS companies playing in this space, a monthly churn rate between 3-5% is generally considered acceptable.
- Mid-Market Companies: As you move upmarket, the stakes get higher. Contracts get longer and your product becomes more deeply embedded in your customer's day-to-day operations. This naturally leads to better retention, with a good monthly churn rate typically falling in the 1-2% range.
- Enterprise Giants: Enterprise customers are the stickiest of all. They face massive switching costs, sign multi-year contracts, and have complex integrations that are a pain to unwind. Best-in-class companies serving this segment often see an annual churn rate below 5%, with the absolute top performers getting it down to 1-2%.
For a more comprehensive look at how your key metrics stack up, you should check out our guide on SaaS metrics benchmarks. Understanding these distinctions is the first step toward setting churn goals that make sense for your business, not someone else's.
Typical Annual SaaS Churn Rate Benchmarks by Company Profile
This table illustrates how acceptable churn rates vary significantly based on the company's revenue and the type of customer it serves.
| Company Profile | Target Customer | Good Annual Churn Rate | Acceptable Annual Churn Rate |
|---|---|---|---|
| Early-stage Startup (<$10M ARR) | SMBs | <15% | 15-20% |
| Growth-stage Scaleup ($10-50M ARR) | Mid-Market | <10% | 10-15% |
| Mature Company (>$50M ARR) | Enterprise | <5% | 5-7% |
As you can see, what's considered "good" for a startup selling to small businesses is very different from the standard for a mature company selling to large enterprises.
What's Happening with SaaS Retention Right Now?
The SaaS industry doesn't stand still, and retention trends are always shifting. It's helpful to have a pulse on where the market is today.
As of early 2024, the average monthly churn rate for B2B SaaS companies has improved significantly to around 3.5%, down from a peak of 7.5% in late 2021. This decline marks a healthier customer retention landscape in the SaaS industry. Learn more about these recent SaaS statistics and insights on SellersCommerce.com.
This trend points to a renewed, industry-wide focus on delivering real customer value and doubling down on retention. An annual churn rate below 5% is widely seen as a sign of a strong, sustainable business.
Of course, company size is still a huge factor. Businesses focused on SMBs usually see annual churn in the 3-5% range, while their enterprise-focused counterparts can get that down to 1-2% thanks to those deeply embedded customer relationships.
Having these benchmarks in your back pocket lets you have much smarter conversations with your team and investors. It shifts the discussion from a single, arbitrary number to a strategic dialogue about what success truly looks like for your specific business.
Finding the Real Reasons Customers Are Leaving
Calculating your SaaS churn rate gives you a number, but it doesn't tell you the why behind it. Churn is always a symptom of a deeper, underlying problem. Guessing at the cause is like trying to fix a car engine by kicking the tires—it's completely pointless.
To actually solve churn, you have to move past the dashboards and become a detective. You need to dig into the real drivers pushing customers out the door. Only then can you stop patching leaks and start fixing the foundation.
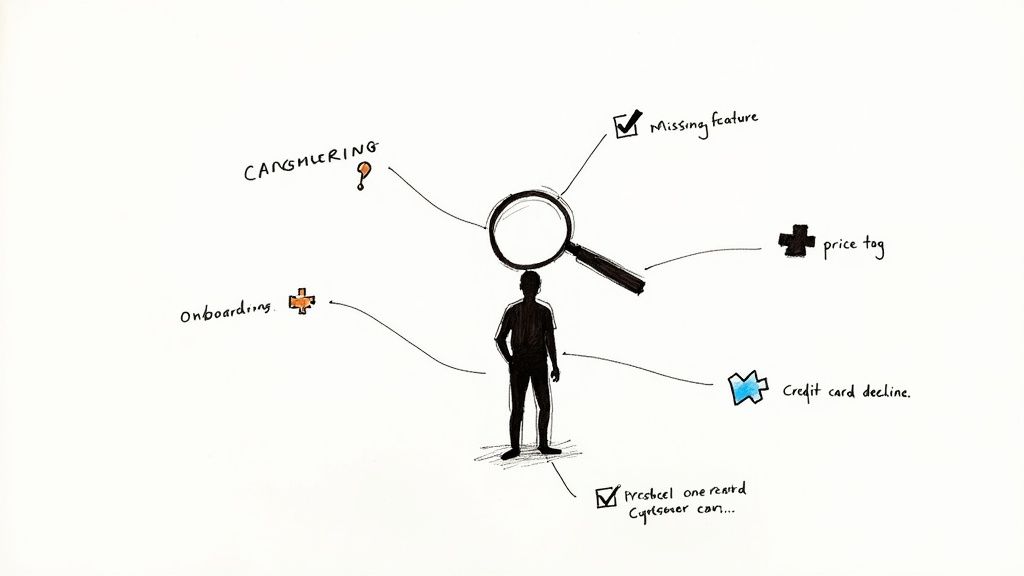
These reasons almost always fall into a few key categories, and each one demands a totally different solution.
A Broken Onboarding Experience
A new customer's first few interactions with your product are make-or-break. If your onboarding is confusing, overwhelming, or just fails to get them to that first "Aha!" moment, they will churn. And they'll do it fast.
Too many operators think onboarding is just a product tour. It’s not. It's about making your customer the hero by helping them solve the exact problem they hired your product to fix.
Think about the project management tool Basecamp. Their onboarding doesn't walk you through every single button. It pushes you to create your first project and invite a teammate—the core actions that prove the product’s value right away.
A customer who doesn't experience the core value of your product within their first few sessions is a churn risk, plain and simple. Their initial excitement fades, and your software becomes just another forgotten login.
A failed onboarding experience is one of the biggest drivers of early-stage churn, often striking within the first 30 days.
Lack of Sticky Product Features
Some products are useful, but not essential. This is the difference between a "nice-to-have" tool and a "must-have" platform. If your product doesn't get deeply woven into a customer's daily workflow, it’s the first thing on the chopping block when budgets get tight.
Sticky features are what create high switching costs. They make the idea of leaving feel painful because the customer has invested their time, data, and processes into your ecosystem.
Here are a few examples:
- Deep Integrations: A CRM that seamlessly syncs with a user's email, calendar, and marketing tools is way harder to replace than one that lives on an island.
- Collaboration Hubs: Tools like Figma or Miro become stickier as more team members get invited and more work gets built inside the platform.
- Historical Data: An accounting software holding years of a company's financial records has an incredibly high switching cost.
If customers can easily swap your tool for a competitor's without much pain, your product just isn't sticky enough.
Poor Customer Fit from the Start
Sometimes, the problem isn't your product—it's who you're selling it to. Signing up the wrong customers is a surefire recipe for a high SaaS churn rate. These are users whose problems your product doesn't really solve, or whose expectations were mismatched by your marketing and sales teams.
This often happens when marketing casts too wide a net, trying to be a solution for everyone. You get a flood of sign-ups who quickly realize the product isn't for them. They churn not because the product is bad, but because it was never the right fit in the first place.
HubSpot famously cracked this by nailing their ideal customer profile (ICP). They stopped trying to be everything to everyone and focused intensely on the specific needs of mid-market companies, a move that dramatically improved their retention.
The Silent Killer: Involuntary Churn
Finally, we have the most frustrating reason of all: involuntary churn. This is when a customer leaves unintentionally, almost always because of a failed payment. Expired credit cards, insufficient funds, or aggressive bank fraud filters can all trigger a subscription cancellation.
This type of churn is especially painful because the customer never actually chose to leave. Industry research suggests involuntary churn can account for a staggering 20-40% of total churn for some SaaS businesses. It's a silent leak that can drain a huge amount of revenue if you're not paying attention.
Diagnosing these specific issues is the first step toward building retention strategies that actually work. For a structured way to identify these problems, check out our guide on a complete churn diagnosis, which offers actionable frameworks you can use today.
Actionable Playbooks to Systematically Reduce Churn
Alright, enough with the theory. Knowing your churn rate is one thing, but actually doing something about it is what separates the winners from the rest. This is where we roll up our sleeves and turn those insights into action.
Forget vague advice like "make a better product." You need specific, repeatable processes—battle-tested playbooks you can put into action tomorrow. The fastest-growing SaaS companies don't just cross their fingers and hope for retention; they build a machine to engineer it.
We're going to break down three of the most powerful playbooks that tackle the biggest reasons customers leave: a confusing start, silent disengagement, and accidental payment failures.
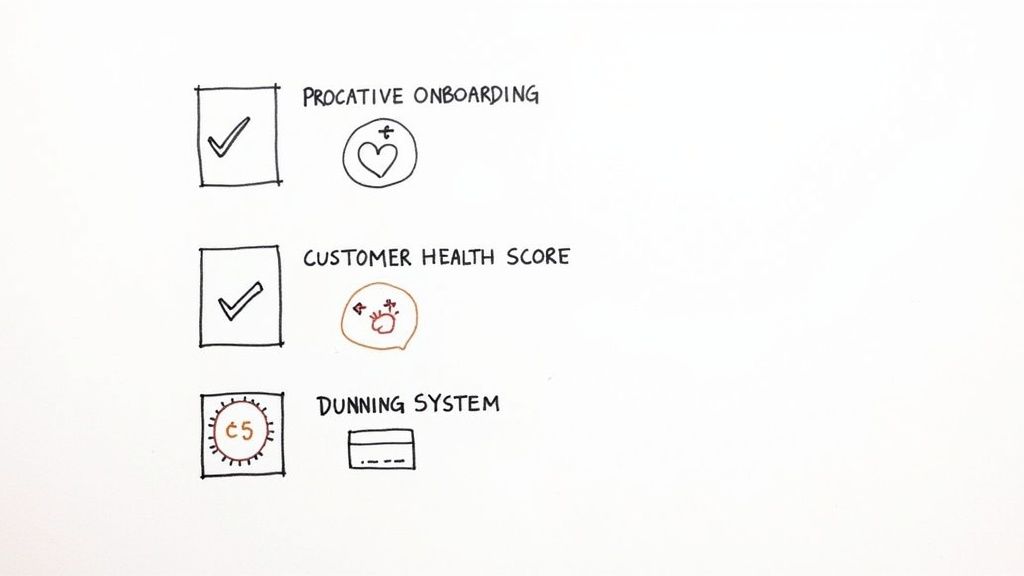
The Proactive Onboarding Playbook
Let's be blunt: the first 30 days are make-or-break. If a new customer doesn't get that first "win" and see why they signed up in the first place, they're gone. This playbook is all about front-loading that value and getting users hooked from day one.
The goal isn't to give them a grand tour of every feature. It's to race them to their "Aha!" moment.
Here’s how you do it:
- Nail Your Activation Metric: What’s the one thing a new user has to do to see your product's magic? For a social media tool, maybe it's scheduling their first post. For a CRM, it could be importing their first 10 contacts. Define it.
- Create a Milestone Checklist: Build a simple, can't-miss-it checklist inside your app. Guide users through the 3-4 essential steps to hit that activation metric. Every time they check one-off, they get a little hit of dopamine that builds momentum.
- Use Behavior-Triggered Emails: Stop sending generic welcome drips. If a user nails step one but gets stuck on step two for 24 hours, send a super-targeted email with a quick tip or a video showing them exactly what to do next.
Real-World Proof: When the help desk software Groove was bleeding customers with a 4.5% churn rate, founder Alex Turnbull dug in. He found that if a user spent just 35 seconds in their first session, they were almost guaranteed to churn. They tore down their old onboarding and rebuilt it to focus on one thing: getting users to answer their very first support ticket. That laser focus was a huge part of how they slashed churn by an incredible 71%.
The Customer Health Scorecard Playbook
The most dangerous kind of churn is the kind that sneaks up on you. This playbook is your early-warning system for spotting at-risk accounts before they go dark. A Customer Health Score is a simple metric you create to quantify how plugged-in a customer actually is.
Think of it as a smoke detector for your customer base. You track key behaviors, assign points, and give each account a score that tells you if they're healthy, at-risk, or in the danger zone.
Building Your Scorecard:
- Product Usage (High Impact): This is your bread and butter. Track things like daily logins, key feature adoption, and how many people on their team are active. A sudden drop here is a massive red flag.
- Support & Success (Medium Impact): Are they filing a lot of support tickets? Did they show up for that webinar you hosted? Positive interactions show they’re still invested.
- Billing & Admin (Low Impact): Little things, like whether their invoices are paid on time or if they've filled out their company profile, can add extra color to the picture.
Once you have this score, you can automate your response. An account’s score dips from "green" to "yellow"? Bam—an automatic task is created for their customer success manager to send a friendly, "Hey, just checking in, saw you haven't used the reporting feature yet. Need a hand?" For a deeper dive, check out our complete customer success playbook for more detailed strategies.
The Dunning Management System Playbook
Let's talk about the lowest-hanging fruit in the entire churn-reduction game: involuntary churn. This is when customers leave because of a failed payment, and it can account for a staggering 20-40% of your total churn. It's literally revenue walking out the door for a simple technical reason.
A dunning management system is just an automated process for handling these billing hiccups. The key is to be helpful and proactive, not aggressive.
A Simple Dunning Sequence:
- The Pre-Dunning Nudge: 7 days before a credit card expires, send a friendly heads-up. "Hey, just a quick reminder that your card is expiring soon. You can update it here to keep things running smoothly."
- First Failure Alert: The instant a payment fails, send an email with a crystal-clear link to update their billing info. No fluff.
- Grace Period & In-App Banners: Don't just shut them off. Give them a 7-14 day grace period. During that time, use a non-annoying banner inside your app to let them know there's an issue.
- Final Reminders: Send a couple more friendly pings during the grace period before you have to send the final cancellation notice.
Tools like Baremetrics or ChurnBuster can automate this whole thing for you, and they often recover over 50% of failed payments. It’s a simple, high-impact system every SaaS business should have. For a broader look, you can explore various strategies to reduce your churn rate and build more customer loyalty.
Churn Reduction Playbook and Impact
To tie this all together, here’s a quick summary of these playbooks, what they target, and how you can measure your success. This table breaks down how to connect a specific churn problem to a direct, actionable solution.
| Churn Driver | Actionable Playbook | Primary Goal | Key Metric to Track |
|---|---|---|---|
| Poor User Onboarding | Proactive Onboarding Playbook | Guide new users to their first "Aha!" moment as quickly as possible. | Time-to-Value (TTV), Activation Rate, 30-Day Retention |
| Silent Disengagement | Customer Health Scorecard Playbook | Proactively identify at-risk customers before they decide to cancel. | Product Engagement Score, Key Feature Adoption Rate |
| Failed Payments | Dunning Management System Playbook | Automatically recover revenue lost to involuntary churn from billing issues. | Failed Payment Recovery Rate, Involuntary Churn Rate |
Implementing these isn't just about plugging leaks; it's about building a fundamentally stickier product and a more resilient business.
Common Questions About SaaS Churn Rate
After digging into all the numbers and playbooks, a few questions always seem to pop up. Getting straight answers to these is key to making sure the core concepts really stick, so you can start making moves on your SaaS churn rate. Let's tackle them head-on.
What Is the Difference Between Voluntary and Involuntary Churn?
Think of it this way: one is a conscious breakup, the other is an accidental ghosting.
Voluntary churn is when a customer makes the deliberate choice to cancel their subscription. This is a direct message about your product, your pricing, or the value they feel they’re getting (or not getting). It’s the kind of feedback that stings, but you absolutely need to listen to it.
Involuntary churn happens when a customer drops off because of a failed payment. It's usually something mundane like an expired credit card or insufficient funds. They didn't mean to leave. You fight voluntary churn by making your product better and proving your value, but you fix involuntary churn with smarter billing and dunning processes.
How Often Should I Calculate My Churn Rate?
You should track it monthly, but analyze it quarterly using cohorts.
Checking your churn rate every month gives you a quick pulse check on the health of your business. But monthly numbers can swing wildly—maybe a big customer left, or it's a slow season. Relying only on that can cause a lot of unnecessary panic.
Cohort analysis is where you find the real story. It cuts through the monthly noise and tells you if your retention strategies are actually paying off over the long haul. It answers the crucial question: are customers who signed up in June sticking around longer than the ones from January?
Can My Churn Rate Actually Be Negative?
Absolutely, and it's the holy grail for any SaaS company. This amazing state is known as Net Negative Revenue Churn.
It happens when the extra money you make from your existing customers (think upgrades, add-ons, and new features) is more than the revenue you lost from the customers who canceled.
Let’s say you lost $10,000 in MRR from cancellations this month. But during that same time, your happy, loyal customers upgraded their plans, adding $15,000 in new MRR. Your net revenue churn is actually -5%. This means your business is growing on its own, just from your current customer base, without even signing up a single new user. It’s the clearest sign you have a healthy, scalable product that people truly value.
At SaaS Operations, we offer battle-tested playbooks, SOPs, and scorecards designed to help you build a more efficient, high-growth business. Stop the guesswork and start using proven systems from operators who've scaled multiple 8-figure companies. Explore our frameworks and accelerate your growth at https://saasoperations.com.