Alright, let’s get right to it. Here’s a free churn rate calculator we built specifically for SaaS operators like us. It’s a straightforward tool designed to give you a quick, no-fluff pulse check on your business. Think of it less as just spitting out a number and more as revealing the story behind your customer retention.
Why Your Churn Rate Is More Than Just a Number
Knowing your churn rate is the first real step toward building a SaaS business that can actually last. This single metric tells you, in black and white, how well you’re delivering on the promises you made during the sales process.
A high churn rate is the ultimate warning light—it screams that there’s friction somewhere in your customer experience. On the flip side, a low rate is a clear signal of a healthy, growing user base that’s getting real value from your product.
But a percentage by itself is pretty useless. The magic happens when you understand its context. What does a 5% monthly churn rate really mean for your runway? How does it look compared to others in your space? Answering these questions is what turns a simple metric into a strategic weapon. If you want to jump ahead and crunch the numbers, a dedicated Churn Rate Calculator is a great place to start.
Understanding the Basic Formula
At its core, the formula for customer churn is refreshingly simple. It’s designed to give you a clean snapshot of customer attrition over a specific period, usually a month or a quarter.
Churn Rate = (Customers Lost in Period ÷ Customers at Start of Period) x 100
So, if you kicked off the month with 500 customers and 25 of them left, your monthly churn rate is 5%. This is the bedrock calculation for all the deeper analysis to come. You can dig into more details and grab our full calculator over at the SaaS Operations free churn rate calculator.
"Churn is a trailing indicator of a leaky bucket. You can't just plug the holes; you have to understand why the water is leaking in the first place. That's where the real work begins."
Customer churn has become a defining metric in the SaaS world. Back in the 2010s, it wasn't uncommon to see monthly churn rates for SaaS companies hovering around 5–7%. The top-tier businesses, however, were already hitting an impressive 1–2%. Knowing this history helps put your own numbers into perspective.
Quick Guide to Interpreting Your Monthly SaaS Churn Rate
Once you've calculated your churn rate, what does that number actually tell you? It's not just data; it's a call to action. I've put together this quick reference table to help you benchmark where you stand and figure out what to do next.
| Monthly Churn Rate | What It Means | Your Immediate Focus |
|---|---|---|
| 0-2% | Excellent. You have a sticky product and strong customer loyalty. | Optimization and scaling successful retention strategies. |
| 3-5% | Good. This is a healthy, sustainable range for many SaaS businesses. | Proactive customer success and identifying at-risk segments. |
| 6-8% | Concerning. Your business is leaking customers at a risky rate. | Diagnosing root causes through customer feedback and surveys. |
| 9%+ | Critical. This level of churn can quickly stall growth and burn cash. | Urgent intervention, focusing on onboarding and product value. |
Think of this table as your starting point. A low churn rate means you have a solid foundation to build on, while a high one is a clear signal that you need to dig in and find the "why" behind the departures.
Getting the Right Data for Your Churn Calculator
You've probably heard the old saying, "garbage in, garbage out." It’s a bit of a cliché, but when it comes to calculating churn, it’s the absolute truth. The accuracy of your churn rate hinges entirely on the quality of the data you feed into it, and honestly, getting that data right is often the hardest part of the whole exercise.
Let's be real—your data is probably scattered. You've got customer info in your CRM, billing details in a platform like Stripe or Chargebee, and usage stats in your product analytics tool. The trick is to pick one single source of truth for your core metrics and stick with it. Don't pull customer start dates from HubSpot one month and then switch to Stripe the next. Consistency is everything.
A founder I know saw their churn rate magically drop by 3% overnight. The reason? They finally stopped including non-paying trial accounts in their 'active customer' count. It was a painful but incredibly valuable lesson in data hygiene.
That one simple change completely shifted their perspective. It allowed them to stop chasing ghosts and focus their retention efforts on the people who had actually pulled out their credit cards.
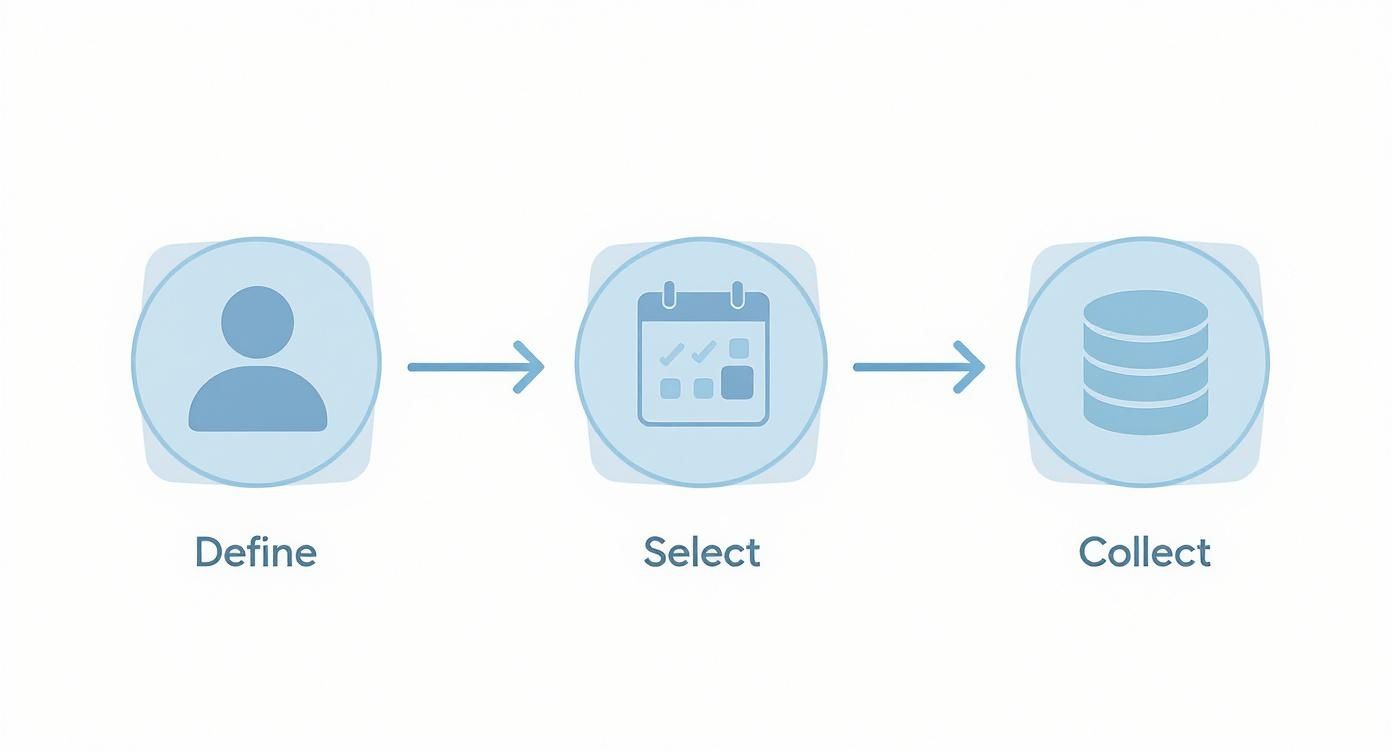
First, Define What You’re Actually Measuring
Before you even think about exporting a CSV, you need to set some ground rules. These definitions are non-negotiable and will become the standard for every churn report you run from now on. Get your team on the same page from day one.
- What is an "active customer"? Is it anyone with a pulse and a login? Or someone who has logged in within the last 30 days? For most SaaS companies, the cleanest definition is simple: an account with an active, paying subscription.
- What is the "time period"? Churn is a rate, which means it needs a timeframe. Monthly is the standard for most SaaS businesses because it aligns with billing cycles, but quarterly can also be insightful. Just pick one and use it consistently so you can make meaningful comparisons.
Once you’ve locked these definitions down, pulling the data becomes way less of a headache. You'll know exactly which filters to use in your tools. In Stripe, for example, you might filter for all subscriptions that were active at the start of the month and then count how many of those became canceled or past_due by the end.
Create a Simple SOP for Pulling the Data
You don't need a 20-page document here. A simple standard operating procedure (SOP) ensures that anyone on your team—you, your co-founder, or a new hire—can pull the right numbers every single time.
Here's a basic checklist to build your SOP around:
- Source System: Name the platform you'll use every time (e.g., Stripe, Baremetrics, etc.).
- Time Period: Define the exact start and end dates (e.g., May 1st to May 31st).
- Customer Segment: Specify who to include. Always exclude trial users. You might also want to segment by pricing plan later on, but start simple.
- Export the Data: Detail the steps to get two key lists: active customers at the start date and customers who churned during the period.
This kind of structured approach takes the guesswork out of the equation. It prevents the silly mistakes that lead to a churn rate that looks great on paper but doesn't reflect reality.
If you want to get more advanced with tracking your metrics, we've put together a comprehensive guide on building your own KPI dashboards in Excel that you'll find super helpful.
Calculating Churn Metrics That Actually Matter
Your basic customer churn rate is a good starting point, but honestly, it's just a single frame in a much longer movie. To really see what's going on with your business, you need to dig into the metrics that seasoned SaaS operators live and die by. These aren't just vanity numbers; they’re the diagnostic tools that tell you how and why you're losing customers and cash.
It’s crucial to look beyond just the customer count. Revenue churn—the actual recurring revenue you lose from cancellations or downgrades—is what top-performing companies obsess over. In 2022, the average monthly revenue churn for SaaS was around 3–4%, while customer churn was a bit higher at 5–7%. That gap tells a story, right? You could be losing low-value customers while keeping your big fish, or worse, the other way around. One number just won't cut it.
Gross MRR Churn: The Unfiltered Truth
Gross Monthly Recurring Revenue (MRR) Churn is the most brutally honest metric you have. It shows you the total MRR you lost from customers who canceled or downgraded in a specific period. No sugarcoating.
This number completely ignores any new revenue, upgrades, or expansion MRR from your existing customers. Think of it this way: this is the raw amount of value leaking out of your business each month before you factor in any growth. It’s the number that should keep your Customer Success team up at night.
- The Formula: (MRR from Canceled/Downgraded Customers) / (Total MRR at Start of Period) x 100
- Why It Matters: This is the North Star for your retention team. It’s a direct measure of their ability to keep customers happy and prevent revenue from walking out the door.
To calculate this, you need to pull clean, precise data from your billing system. This simple process is a good framework for making sure your inputs are solid every single time.
It all boils down to defining who you're measuring, picking a consistent timeframe, and making sure your data is accurate. Get that foundation right, and your metrics will be far more reliable.
Net MRR Churn: Your Growth Engine's Health Report
This is where the full story comes into focus. Net MRR Churn starts with your Gross MRR Churn and then subtracts any expansion MRR you gained from existing customers—think upgrades, cross-sells, or add-ons.
Investors love this metric because it shows the true health of your growth engine. A negative Net MRR Churn is the holy grail for any SaaS business. It means your existing customer base is actually growing on its own, more than offsetting any losses.
I once worked with a B2B SaaS founder whose company had a fantastic -2% Net MRR Churn. On the surface, it looked like they were crushing it. But when we dug in and calculated their Gross MRR Churn, it was a shocking 9%. Their aggressive upselling was completely masking a massive retention problem, which triggered a total overhaul of their onboarding process.
This kind of thing happens more often than you'd think, and it’s a perfect example of why you need both metrics. To really get a handle on your business, you need to move beyond simple formulas and get into in-depth churn rate analysis to understand what’s truly driving your numbers.
Logo Churn: The Raw Customer Count
Finally, there’s Logo Churn, which most people just call Customer Churn. It's the most straightforward calculation of them all: the percentage of individual customers (or "logos") you lost during a period.
While it doesn’t have the financial nuance of MRR churn, it gives you a clear headcount of your attrition. This is a vital number for marketing and product teams who are trying to understand user behavior from a high-level, human perspective.
Finding the 'Why' Behind Your Churn Rate
https://www.youtube.com/embed/Frl_7AYLHSw
So you've run the numbers through a free churn rate calculator and you've got your percentage. Let's say it’s 5%.
What does that number actually mean? On its own, absolutely nothing. Is it good? Is it a five-alarm fire? The honest answer is: it depends entirely on your context.
A number is just a symptom. Our real job as operators is to play detective and uncover the root cause. This is how you shift from someone who just tracks metrics to someone who actively improves them. The first step? See how your number stacks up against industry averages.
A 5% monthly churn might be perfectly fine for a B2C SaaS selling to freelancers, but for an enterprise product with long sales cycles, it would be a complete catastrophe. Who you sell to really dictates what's "normal."
From Data to Diagnosis
Once you have a benchmark, it’s time to stop staring at the what and start digging into the why. This is where you have to marry your quantitative data (the churn rate itself) with qualitative gold. You need to get inside the heads of the customers who are walking out the door.
Believe me, the best insights won't come from a spreadsheet. They come from actual human feedback. Time to roll up your sleeves and start talking to people.
- Cancellation Surveys: The second a customer hits that "cancel" button is your golden opportunity. Ask one simple, open-ended question: "What's the main reason you're leaving?" Avoid multiple-choice—you want their raw, unfiltered thoughts.
- Support Tickets: Your support inbox is a treasure trove of information. Sift through it and look for recurring complaints, frustrated language, or common feature gaps mentioned by customers who eventually bailed.
- One-on-One Interviews: This is easily the most powerful tool you have. Reach out to a handful of recently churned customers and just ask for 15 minutes of their time. You'd be surprised how many are willing to share their honest experience.
"We cut our churn by over 30% in a single quarter. The secret? Our cancellation survey kept pointing to a missing integration. It was something our dev team knocked out and shipped in a single two-week sprint."
This kind of quick win is more common than you'd think. Often, the reason customers leave is a single point of friction that is entirely fixable. You just have to find it first. For more on this, we've developed a simple framework for your churn diagnosis and analysis that can help you structure this process.
Building Your Feedback Loop
The last piece of the puzzle is creating a system that turns these insights into action. This isn't a one-and-done project; it's an ongoing operational rhythm.
You need a process. Set up a system where feedback from cancellation surveys and support tickets is tagged, categorized, and reviewed by the product team every single week.
This constant feedback loop is what separates the fast-growing SaaS companies from the ones who can't figure out why their bucket is always leaking. It turns customer feedback from noise into your most valuable asset for building a better product.
So, What Can You Actually Do About Churn?
Knowing your churn rate is one thing. Actually doing something about it? That’s where the real work begins. Moving from data to action isn't about some high-level theory; it's about rolling up your sleeves and implementing specific, battle-tested strategies that top SaaS operators rely on to keep customers happy and sticking around.
The real goal here is to stop obsessing over churn and start focusing on its flip side: customer retention. It’s a simple calculation, really. Retention Rate is just 100% – Churn Rate. If your SaaS has a monthly churn of 2%, you’ve got a solid 98% retention rate. Historically, the best in the business shoot for annual retention rates of 85–90%, which means keeping that annual churn between 10–15%. If you want to dive deeper into how these numbers stack up, check out these churn rate calculator benchmarks.
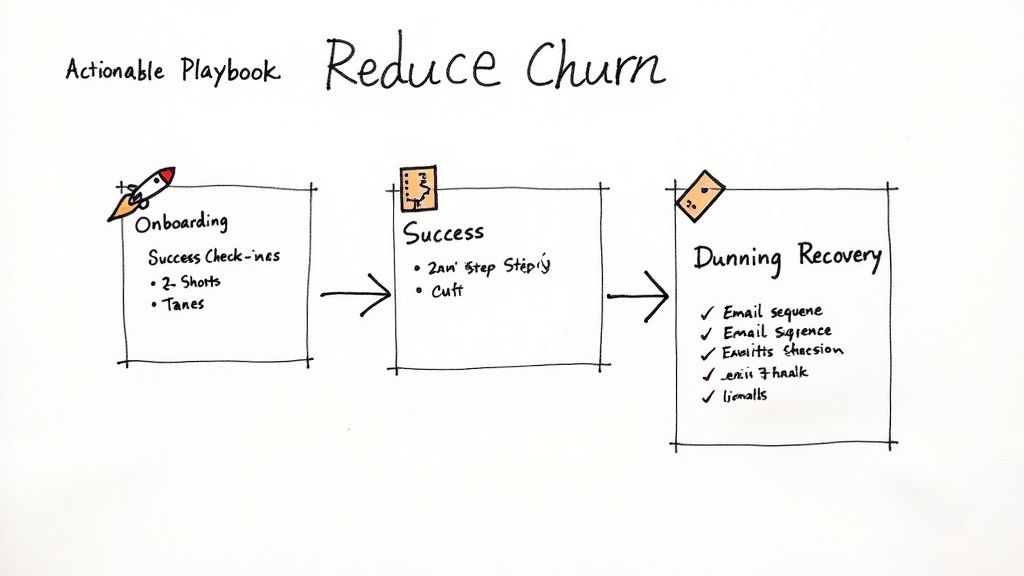
Nail Your Onboarding to Deliver Instant Value
A customer's first few moments with your product can make or break the entire relationship. Seriously. A clunky, confusing, or just plain underwhelming onboarding experience is a one-way ticket to churn city. Your mission is to get that new user to their first "aha!" moment as fast as humanly possible.
Here's how you do it:
- Pick one key outcome. Don't throw every feature at them at once. Identify the single most valuable thing they can do and build your entire onboarding flow around getting them there.
- Use in-app checklists. People love checking things off a list. It gives them a clear path forward and a little hit of dopamine with every completed step.
- Make the welcome personal. Greet users by name. Better yet, tailor their first steps based on the goals they told you they had when they signed up.
Start Doing Proactive Customer Health Checks
Don't wait for a customer to complain. By the time they send that angry email, it’s often too late. You need to get ahead of the problem. Set up triggers using your product data to flag accounts that are starting to drift away—things like a drop in logins or a decline in key feature usage are huge red flags.
When a customer’s "health score" dips, have a real human from your customer success team reach out. This isn't a sales pitch. It's a simple, helpful email offering assistance, sharing a useful case study, or inviting them to a quick chat to make sure they're getting their money's worth.
Create an "At-Risk Customer" Email Sequence
When you've identified an account that's on the verge of churning, a targeted email sequence can be a lifesaver. A B2B SaaS founder I know put together a simple three-part sequence that successfully re-engaged 40% of their at-risk customers. It was a game-changer.
Subject: Quick question about [Your Product Name]
"Hi [First Name],
Just checking in to see how things are going with [Your Product Name]. I noticed you haven't [completed a key action] recently, and I wanted to make sure you have everything you need to succeed.
Are you running into any roadblocks I can help with?"
See how that works? It’s personal, helpful, and not at all accusatory. By putting practical playbooks like these into motion, you can systematically reduce your churn rate and build a much more resilient SaaS business.
Got Questions About Churn? We've Got Answers
Even with the best spreadsheet in hand, you're going to run into weird situations that don't quite fit the formula. It happens to everyone. Let's tackle some of the most common questions that pop up when SaaS operators start digging into their churn numbers.
What's a Good Churn Rate, Anyway?
This is easily the most common question, and the real answer is… it depends. A "good" churn rate is completely relative to who you're selling to.
Comparing a B2C app to an enterprise platform is like comparing apples to oranges. Here’s a rough guide based on who you serve:
- Enterprise SaaS: These are big, sticky contracts. If your monthly customer churn is creeping over 1%, it's time to investigate.
- SMB SaaS: Things are a bit more fluid here. A monthly churn rate in the 3-5% range is generally considered healthy.
- B2C / Prosumer SaaS: This is the Wild West. Customers are less sticky, so seeing 5-7% monthly churn isn't uncommon.
The most important benchmark isn't some industry-wide "magic number." It's your own historical performance. Focus on making incremental improvements against your past self. That's the real win.
How Do I Handle Annual Contracts?
Ah, the annual contract dilemma. A customer tells you in June they won't be renewing when their contract is up in December. Do you mark them as churned now, or then?
The standard best practice is to record the churn only when the subscription officially expires and the revenue actually stops hitting your bank account. This keeps your financial data clean and accurate.
That said, you absolutely must track their intent to cancel internally. Think of it as a leading indicator—a crystal ball for your future revenue. It gives you a six-month heads-up to either try and save the account or adjust your forecasts.
Getting this right is crucial because it directly feeds into other critical metrics. For instance, understanding the timing of churn is a huge part of your lifetime value calculation for SaaS, which we break down in another guide.
Ready to turn these insights into action? The playbooks and SOPs from SaaS Operations give you battle-tested frameworks to improve retention, streamline operations, and accelerate growth. Stop guessing and start implementing what works.
Explore our proven SaaS playbooks at https://saasoperations.com.
Article created using Outrank