Boost SaaS Revenue Per Employee With Actionable Efficiency Strategies
Quick Answer For SaaS Revenue Per Employee
Below is a quick reference table that defines the metric and shows a sample calculation.
Quick Reference Table
| Metric | Formula |
|---|---|
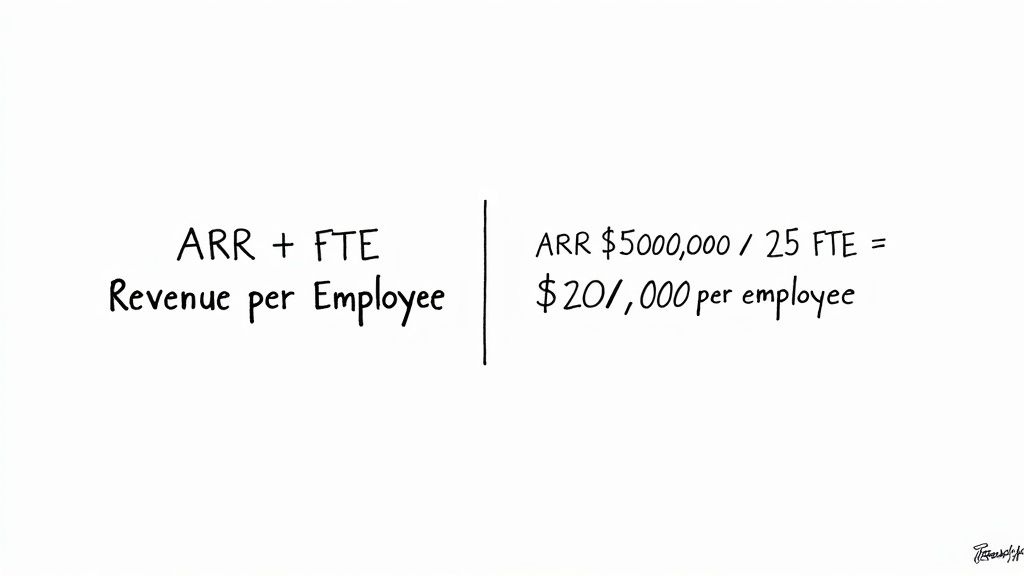
| SaaS Revenue Per Employee | ARR ÷ Total Employees |
| Example Calculation | $5,000,000 ÷ 50 = $100,000 |
Use this table as a template—just swap in your ARR and headcount to see how your team stacks up.
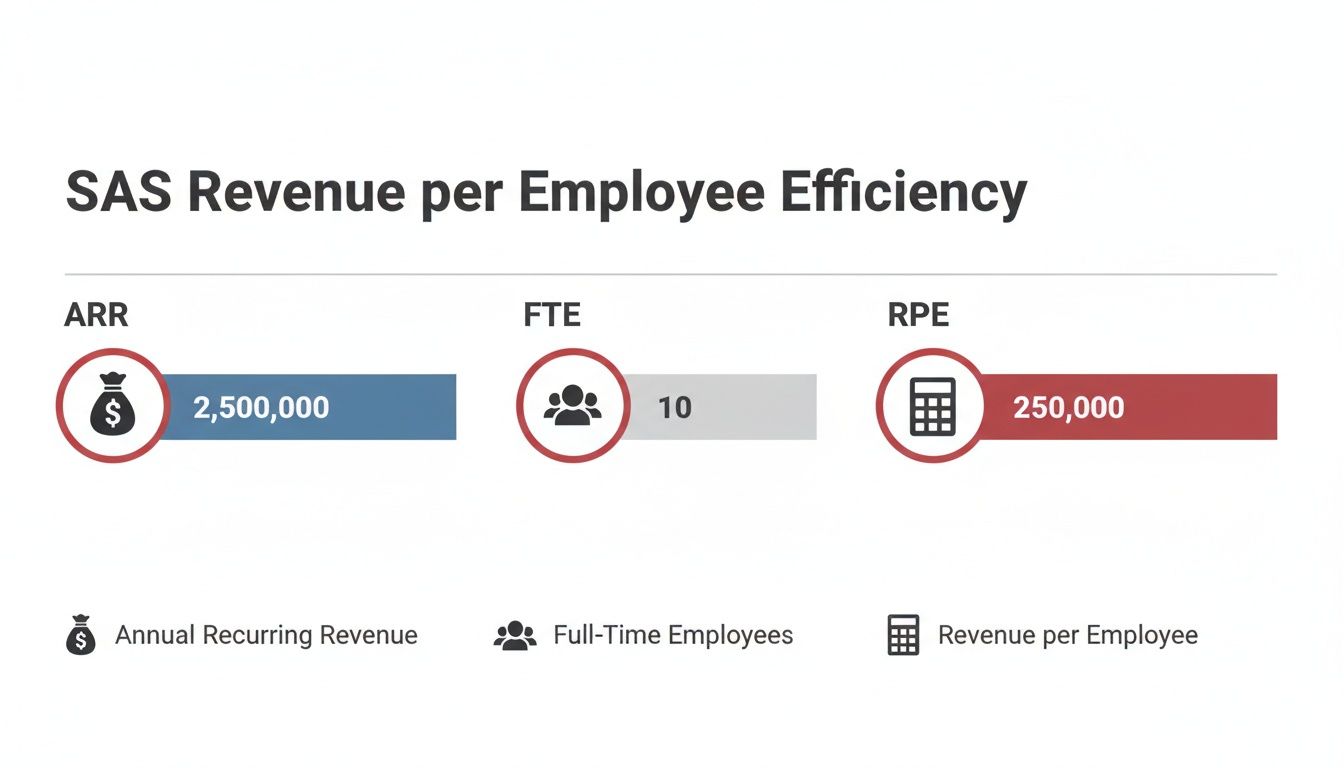
- What It Measures: Yearly ARR generated by each full-time equivalent
- Why It Matters: Reveals hiring inefficiencies or resource gaps
- How To Calculate: Divide your ARR by total FTE count
- Guide Roadmap: Definitions, benchmarks, scenarios, checklist, playbook
Imagine ARR as cargo and each employee as a ship. The bigger the average load per vessel, the more efficient your setup. BrightAnalytics, a $5M ARR startup, used this analogy and pinpointed support automation, boosting their RPE from $80k to $110k in 12 months.
Pro Tip Tracking revenue per employee alongside Sales Velocity and Net Revenue Retention uncovers hidden productivity drivers.
Whether you’re planning hires or building a dashboard, start here. See how revenue per employee fits into a broader metric toolkit in our guide on SaaS KPIs.
Understanding SaaS Revenue Per Employee
At its core, revenue per employee divides your ARR by the total full-time equivalent staff. It’s a quick gauge of how much each person—from devs to support—brings in annually.
How Components Fit Together
- ARR: Predictable subscription revenue over 12 months
- FTE: Converts contractors, part-timers, seasonal hires into full-time units
- Contractors count as 0.5–0.7 FTE based on hours
- Seasonal staff prorated across active months
CloudSync (ARR $30M) audited their FTE conversions, catching an undercounted 10 contractors. Updating rates boosted their reported RPE by 12%.
Action Item: Audit your FTE conversion assumptions this week—update contractor and part-timer ratios in your spreadsheet.
When This Metric Shines
- Early-stage hiring ramps: spot if new reps move the needle
- Later stages: detect R&D growth watering down productivity
- Budget planning, headcount forecasts, investor pitches
“Tracking revenue per employee alongside headcount plans surfaces hidden inefficiencies,” says a SaaS operator with $50M ARR.
For a deeper dive, check our guide on employee key performance indicators.
| Role | FTE Equivalent |
|---|---|
| Full-Time Staff | 1.0 |
| 20-Hour Part-Time | 0.5 |
| 6-Month Contractor (40h/week) | 0.5 |
| Seasonal Intern (3 months) | 0.25 |
Interpreting Rising Or Falling Values
- Climbing RPE: automation, pricing adjustments, higher individual output
- Falling RPE: strategic hires (sales, product) that pay off later
- Pair with Sales Velocity and Net Revenue Retention to avoid false peaks
Avoid Common Traps
- Include contractors in headcount math
- Annualize data—exclude partial-year revenue
- Filter out one-off revenue spikes before analysis
Best Pairings
Track these alongside revenue per employee:
- Time To Value for onboarding speed
- Net Revenue Retention for growth health
- Sales Cycle Length to spot bottlenecks
- Support Ticket Resolution Time to balance service load
Benchmark Ranges For SaaS Revenue Per Employee
Every SaaS leader wants to know how their team stacks up. In 2025, the median RPE for private SaaS companies hit $129,724, up from $125,000 a year earlier. For full breakdown, check SaaS Capital’s survey here.
Revenue Per Employee Benchmarks By ARR Stage
| ARR Range | Median Revenue Per Employee |
|---|---|
| < $1 M | $71,429 |
| $1–5 M | $120,000 |
| $5–20 M | $151,515 |
| > $50 M | $164,439 |
Funding Model & Regional Trends
- Bootstrapped firms often hit higher RPE; equity-backed stretch RPE with growth hires
- North America: $135,000 per employee
- EMEA: $120,000
- APAC: $110,000
Action Steps:
- Calculate your RPE and map to the table above.
- Select peer group by ARR stage and funding model.
- Identify gaps—onboarding, pricing, churn.
- Set quarterly targets to move from median to top-quartile.
Revisit benchmarks regularly via our SaaS metrics benchmarks guide.
Modeling SaaS Revenue Per Employee Scenarios
Tie your hiring plan to revenue goals with real-world scenarios. Swap in your figures to see headcount impact on productivity.
Scenario One: Lean Startup Model
Start with $1M ARR and 5 FTEs, target $5M ARR with 15 people by Q4.
Key Assumptions:
- One new hire per quarter from Q2
- 4-week onboarding ramp per rep
- 0.6 ARR per quota unit in sales efficiency
| Quarter | ARR Forecast | Headcount | RPE |
|---|---|---|---|
| Q1 | $1,000,000 | 5 | $200,000 |
| Q2 | $2,200,000 | 6 | $366,667 |
| Q3 | $3,500,000 | 7 | $500,000 |
| Q4 | $5,000,000 | 15 | $333,333 |
Case Study: PixelWare used this model to peak at $500k RPE in Q3, then optimized support hires to sustain $350k.
Action Item: Download our template, plug in your ARR/headcount, then test ramp-time reductions to hit earlier peaks.
Scenario Two: Established Vendor Model
From $20M ARR and 50 FTE to $50M ARR and 120 employees in three years, factoring churn and support overhead.
Variables:
- 8-month average sales cycle
- 8% annual churn
- 1 support rep per 30 customers
- 0.7 FTE for product & ops overhead
| Year | ARR Forecast | Headcount | RPE |
|---|---|---|---|
| 1 | $25,000,000 | 60 | $416,667 |
| 2 | $35,000,000 | 85 | $411,765 |
| 3 | $50,000,000 | 120 | $416,667 |
OmniSoft identified churn in Year 2 as the main RPE drag—revamping onboarding cut it from 10% to 6%, restoring efficiency.
Learn more in our revenue forecasting methods in our guide on precise headcount-to-ARR planning.
Customizing Your Forecast
- Adjust ARR curves for seasonality
- Calibrate ramp times to your past performance
- Include fractional FTEs for product, marketing, support
- Simulate hiring freezes or budget delays
Next Steps:
- Embed these scenarios in your quarterly planning rhythm.
- Sync assumptions with finance, sales, product leads.
- Set a monthly “planned vs. actual” review—treat a >10% RPE dip as a red-line trigger.
Diagnostic Checklist For SaaS Revenue Per Employee
Use this list to rank potential fixes by ROI and avoid knee-jerk headcount changes. Each section includes probing questions, metrics, and red-flag thresholds.
1. Sales Efficiency Ratios
Aim for 0.5 ARR per $1 spent on sales.
- Ramp time to full quota
- Average quota attainment
- Is Sales Velocity slipping?
Red Flag: A rep delivering < $150k ARR in first 12 months.
2. Onboarding & Support Overhead
Measure:
- Time to first value (days)
- Tickets per customer in first 90 days
- Customer satisfaction post-onboarding
Red Flag: > 30 days to first value or > 5 tickets per new client.
3. Average Contract Value
Audit:
- ACV distribution by tier
- Renewal rates by deal size
- Discount levels vs. list price
Red Flag: Sub-$5k ACV deals demanding full-service support.
4. Churn Impact
Track:
- Gross & net retention rates
- ARR lost to churn quarterly
- Customer lifetime value trends
Red Flag: Annual churn above 8%.
5. Organizational Silos
Review:
- Cross-department meeting cadence
- Shared KPI dashboards
- Handoff SLAs
Red Flag: Conflicting metrics or missing scorecards doubling effort.
Next Steps: Rank issues by potential ARR impact. For example, cutting onboarding to 14 days could free support capacity for two more sales reps without hiring.
Read our guide on measuring team productivity How To Measure Team Productivity.
Actionable Playbook To Improve SaaS Revenue Per Employee
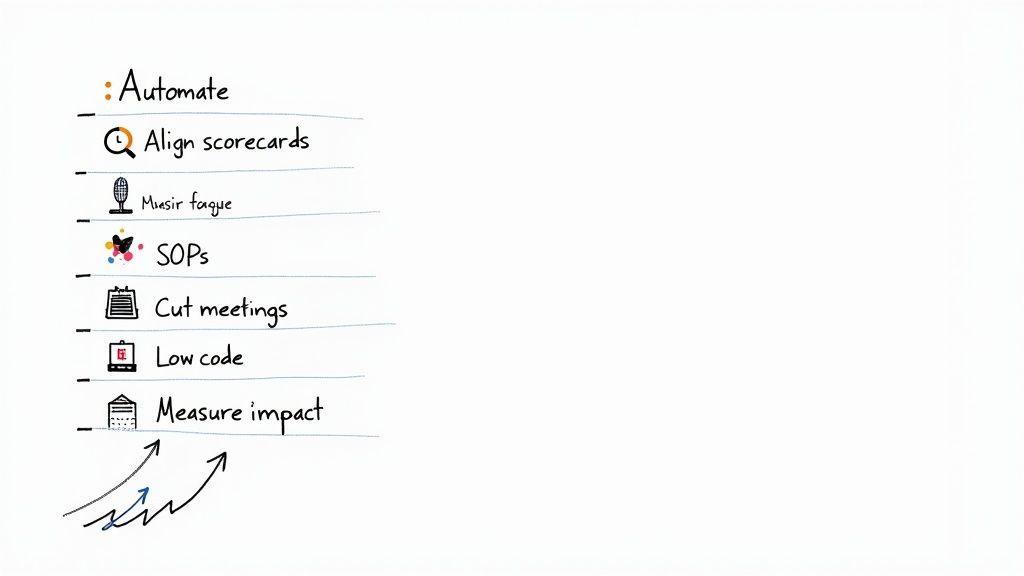
This playbook delivers hands-on steps to lift your SaaS revenue per employee. Focus on processes, automations, and team alignment with clear goals. We’ve seen hundreds of SaaS operators adopt this approach, driving 15–25% RPE gains in six months.
1. Refine Processes With Meeting Rhythms
- Replace daily standups with 3 weekly check-ins for product/support.
- End each meeting with clear owners and next steps.
Tip: Dropping one nondecisive meeting per cycle reclaims 5 hours per person weekly.
2. Implement Cross-Functional Scorecards
Shared dashboards align sales, support, engineering around key metrics:
Sample Scorecard Snippet
| KPI | Definition | Target |
|---|---|---|
| Deals Closed Per Rep | Monthly ARR generated by each sales rep | $120k |
| Support Tickets Per Rep | Tickets resolved per support rep monthly | 4 |
| Deployment Frequency | Deployments pushed to production each month | 10 |
Action Item: Build your scorecard in a BI tool and review weekly.
3. Automate Repetitive Tasks Using Low Code
Pick a repeatable flow—e.g., web form leads—and automate:
- Capture leads
- Auto-send welcome email
- Log activity in analytics
Automation frees 2–3 hours per employee weekly.
4. Establish SOPs For Consistent Execution
A shared wiki of SOPs prevents drift and errors:
- Step-by-step tasks with roles
- Entry/exit criteria
- Links to templates and scripts
SaaS teams using SOPs report a 30% drop in rework.
By tightening meetings, rolling out scorecards, automating workflows, and enforcing SOPs, you’ll see your SaaS revenue per employee climb. Slot these tactics into quarterly plans, set a 10% RPE dip as a red-line, and celebrate wins at all-hands.
Start with one pillar this sprint: map the process, automate or scrap low-value steps, and iterate.
FAQ
Headcount Boundaries
Include:
- Full-time staff = 1.0 FTE
- Part-timers/contractors prorated (20 h/wk = 0.5 FTE)
- Three-day-a-week contractors ≈ 0.7 FTE
- Seasonal hires averaged by active months
Benchmark Variations
Snapshot from SaaS Capital’s survey:
- Sub-$1M ARR: $71,429 per employee
- $1–5M ARR: $120,000
- $5–20M ARR: $151,515
-
$50M ARR: $164,439
Median RPE in 2025: $129,724.
Price And Staff Impact
- 10% price hike lifts RPE but risks churn
- 5% headcount cut bumps ratio but strains service
- Map total cost to serve for full clarity
More Resources And Next Steps
- Modeling sheets for headcount scenarios
- Pricing-lever templates
- Bottleneck diagnostic checklists
Dig deeper in our SaaS metrics benchmarks guide, then start these efficiency tactics—fast.
Explore our proven playbooks, templates and SOPs at SaaS Operations to start closing gaps today.