How to Measure Team Productivity for SaaS Growth
Trying to measure team productivity by just tracking hours is a losing game. The real goal is to connect the day-to-day work your team does with actual business results. To get there, you have to define what success really looks like for your team.
From there, you can pick the right metrics, pull them together into a balanced scorecard, and automate the data collection. This frees you up to focus on coaching and strategy instead of just counting things. It's about shifting the conversation from "Are we busy?" to "Are we making an impact?"
Moving Beyond Busywork to Measure Real Impact

In the SaaS world, it’s so easy to mistake activity for achievement. We see teams closing tons of tickets, shipping feature after feature, or churning out blog posts, and we naturally assume they're crushing it. But a lot of the time, this is just "performance theater"—everyone looks busy, but the business isn't actually moving forward.
This old-school view of productivity, the one that’s all about raw output, just doesn't cut it anymore. Logging hours or clearing a task list doesn't mean you've built a better product or made your customers happier. The real challenge, and where the best teams excel, is in measuring the impact of their work, not just the volume.
Shifting Focus From Output to Outcomes
The most important mental shift you can make is to stop measuring output and start measuring outcomes. Think of it this way: an output is the thing you made (like a new feature), while an outcome is the result that thing created (like a 15% increase in user engagement).
This distinction is everything for a SaaS company. Your success lives and dies by things like customer retention, user adoption, and revenue growth. Your metrics have to reflect that.
Let’s break it down:
- Outputs are easy to count, but they tell an incomplete story. It’s simple to track how many pull requests your engineering team completes. But that number says nothing about code quality or whether it improved the user experience.
- Outcomes tie directly to what the business cares about. Measuring a feature's adoption rate or its effect on customer churn draws a straight line from your team’s hard work to the company's bottom line.
- Focusing on outcomes builds a culture of ownership. When your team is measured by the results they deliver, they start thinking more deeply about customer problems and how to solve them.
The goal isn't just to ship more code or answer more tickets. It’s to create value that customers will happily pay for. Nailing this mindset is the first real step toward building a high-performing team.
If you want to see what this looks like in practice, check out this analysis of Stripe's strategy for achieving high pull request volume. It’s a great look at how the right processes and culture can lead to truly impactful work.
Why Traditional Metrics Fall Short
Leaning on old-school, activity-based metrics can do more harm than good. It actually encourages teams to chase quantity over quality, which almost always leads to rushed work and burnout.
Imagine a support agent whose only goal is to hit a daily ticket quota. They might close conversations quickly without actually solving the customer's problem, which tanks customer satisfaction. Or a marketing team obsessed with publishing volume might create a dozen generic articles that attract zero qualified leads. They’re busy, for sure, but their efforts aren’t growing the business.
This table really clarifies the difference between tracking activity and tracking impact.
Key Differences Between Output vs Outcome Metrics
| Metric Type | Focus | Example Metric | Why It Matters for SaaS |
|---|---|---|---|
| Output | Activity & Volume | Number of Features Shipped | Easy to track but says nothing about whether customers use or value the features. |
| Outcome | Impact & Value | User Adoption Rate of New Features | Directly measures if the team's work is solving a real user problem and adding value to the product. |
| Output | Effort & Time | Hours Logged on a Project | Measures cost but provides zero insight into the quality or effectiveness of the work performed. |
| Outcome | Business Result | Net Revenue Retention (NRR) | Connects team efforts in product, success, and sales to the ultimate goal of retaining and growing customer accounts. |
This isn't just about changing what you measure; it's about changing how you think about success.
This guide will walk you through a modern framework designed for SaaS leaders like you. The goal is to bring clarity and strategic alignment to your measurement process, helping you build a culture of trust where real progress is celebrated over mere busyness.
Choosing Productivity Metrics That Actually Matter

Alright, you’re on board with measuring outcomes over outputs. Now comes the tricky part: picking the right things to measure. This is where so many companies go off the rails. They grab a bunch of generic KPIs that look impressive on a dashboard but tell you absolutely nothing about what’s actually moving the needle.
If you want to truly understand team productivity, you have to select metrics that tell a story—a story about your team's unique contribution to the business.
Generic metrics lead to generic results. I can't tell you how many engineering teams I've seen get stuck on "lines of code written." It's a classic trap. It incentivizes quantity over quality and is completely silent on whether the code is stable or if customers even like the feature. A much smarter approach is to track things like cycle time—how long it takes an idea to get into the hands of a user—and deployment frequency.
This same thinking applies everywhere. Your marketing team shouldn't be judged just on how many blog posts they publish. Instead, you should be laser-focused on their MQL-to-SQL conversion rate, which shows their direct impact on the sales pipeline. These are the kinds of specific, outcome-driven metrics that separate the teams that are just busy from the ones that are truly productive.
Creating a Balanced View of Performance
Another common mistake is getting hyper-focused on a single metric. If your customer support team is measured only on "average handle time," guess what happens? They start rushing people off the phone. Customer satisfaction plummets, and issues go unresolved. The key is to build a balanced scorecard that looks at performance from multiple angles.
A solid framework for your metrics should always include a mix from these four areas:
- Quantity: How much work is getting done? For a sales team, this could be the number of demos they book.
- Quality: How good is the work? For that same sales team, you might look at their lead-to-opportunity conversion rate.
- Efficiency: What resources did it take? A great example here is the cost per lead acquired.
- Business Outcome: How did it impact the company's goals? For sales, the ultimate prize is new monthly recurring revenue (MRR).
When you combine these, you get a holistic picture. It keeps you from improving one area at the expense of another. For a deeper look at what you should be tracking, our guide to essential SaaS KPIs is a great resource.
A great set of metrics doesn’t just track what happened; it provides clues on what to do next. It should highlight strengths to double down on and weaknesses to address, turning data into a roadmap for improvement.
Involve Your Team in the Process
Want to know the best way to make sure your metrics are actually meaningful? Ask your team. When people have a voice in how their success is measured, they feel a real sense of ownership. It’s no longer a top-down mandate; it's a collaborative mission.
This approach also taps into incredible on-the-ground expertise. Your team knows what activities actually drive results. They can help you sidestep vanity metrics and zero in on the numbers that truly matter. Your support reps, for instance, will know immediately whether "first response time" is a better indicator of customer happiness than "total tickets closed."
Recent data shows just how important it is to get this right. In the U.S., labor productivity growth hit a 20-year high of +2.7% in 2023, largely because of smarter workflows. Yet, employees still spend about 60% of their day on "work about work"—admin, meetings, and tasks that aren't core to their roles. Involving your team in setting metrics helps you identify and measure the activities that cut out that waste.
When you build this process collaboratively, you're doing more than just picking better metrics. You're building trust. You’re sending a clear signal that this is about growth and support, not micromanagement. That's the foundation you need for a truly productive culture.
Building a Balanced Team Productivity Scorecard
So, you've nailed down your core metrics. Now what? The next hurdle is making sense of all that data. It's incredibly easy to get lost in a sea of numbers, completely unsure of what they’re actually telling you.
This is exactly where a balanced team productivity scorecard saves the day.
Think of it less like a report card and more like a flight dashboard for your team. It’s designed to give you a quick, at-a-glance view of performance by pulling together different types of metrics to tell the whole story. It’s the tool that helps you graduate from simply collecting data to truly understanding it.
Structuring Scorecards for Clarity and Impact
A great scorecard isn’t just a random assortment of numbers on a page; it’s organized with a clear purpose. The best ones are structured at different levels—individual, team, and even department—and they all ladder up to the same high-level business goals.
For example, a customer success rep’s personal scorecard should zero in on the things they can directly influence.
- Time to First Response: How fast are they getting back to customers?
- CSAT Scores: What’s the direct feedback on the quality of their help?
- Ticket Resolution Rate: What percentage of issues are they actually solving?
From there, the team-level scorecard rolls these individual metrics up and adds a layer of business context. A Customer Success team scorecard might combine the group's average CSAT score with a major outcome metric like Net Revenue Retention (NRR). This directly connects their daily support work to the company's financial well-being.
To get a deeper look at this, check out our complete guide on creating effective business scorecards and dashboards.
Visualizing Data for Actionable Insights
How you show the data is just as critical as the data itself. A cluttered, confusing scorecard will get ignored every time. The goal is to present information in a way that makes trends, wins, and opportunities practically jump off the page. Think simple charts, intuitive color-coding, and clear labels that draw attention to what really matters.
This simple visual shows how you can combine basic inputs to create a much more insightful metric, like a completion rate.
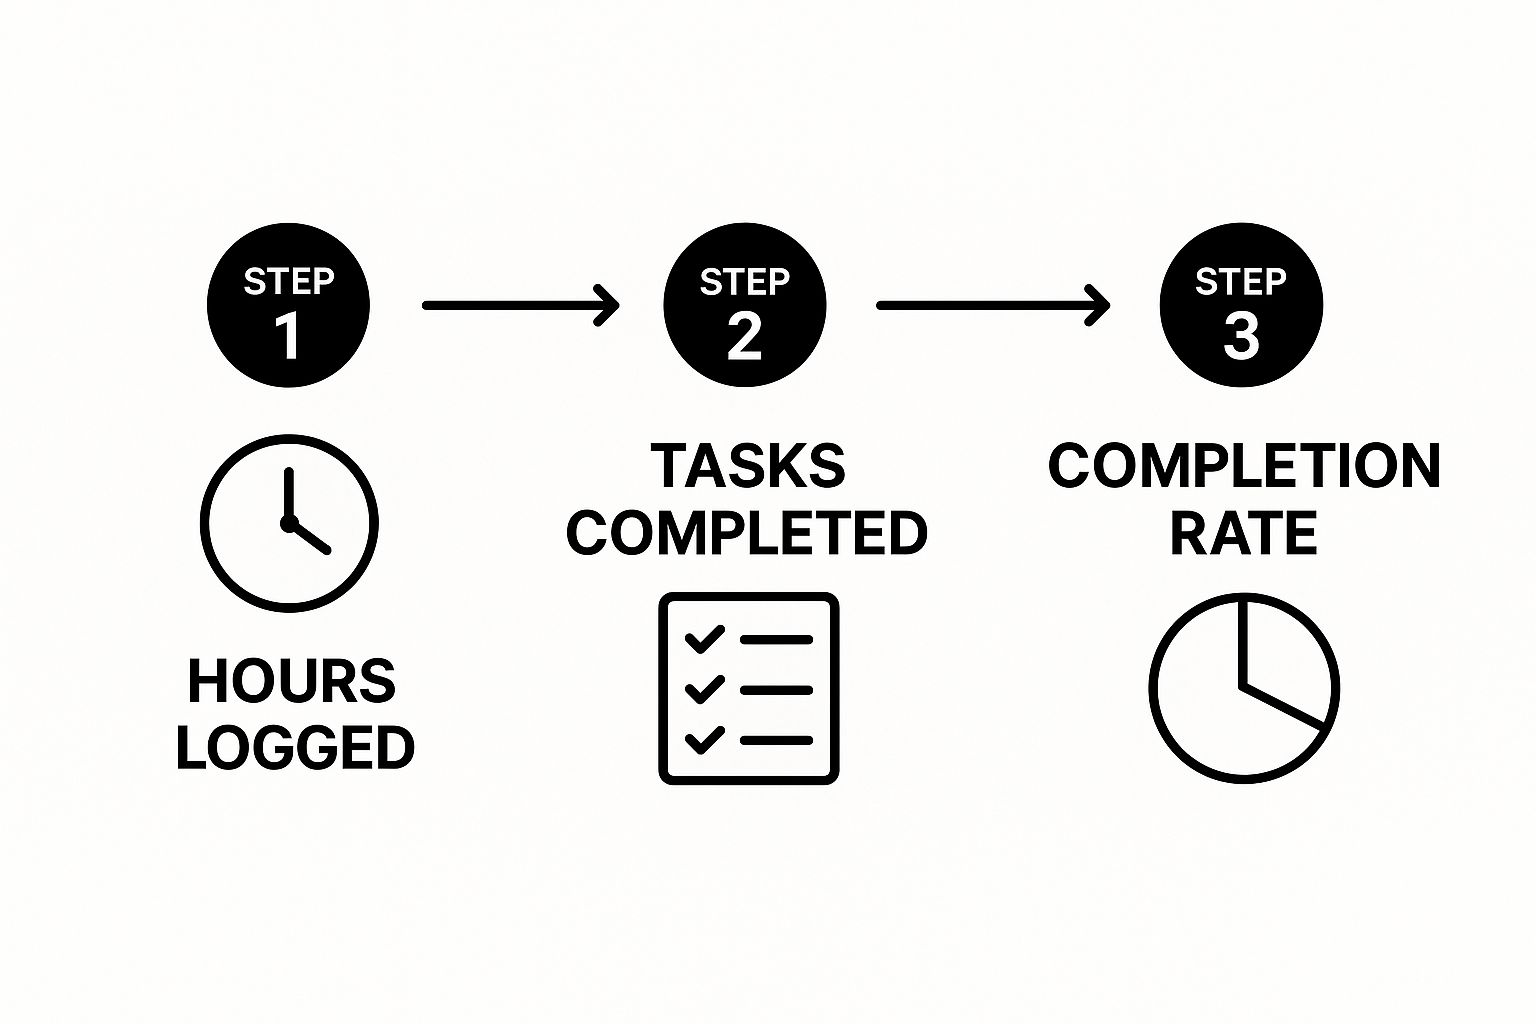
By showing the link between effort (hours logged) and output (tasks finished), you create a powerful efficiency metric. It tells a much richer story than either data point could on its own.
This kind of blended approach is essential. On a much larger scale, economists do the same thing by measuring gross domestic product (GDP) per hour worked. This provides a clear look at economic output per worker. Data from the International Labour Organization reveals Luxembourg as the most productive country, generating an average of $166.1 per hour worked, followed by Ireland at $139.1 and Norway at $123.6.
Turning Performance Tracking Into a Conversation
At the end of the day, a scorecard is a communication tool. It’s meant to spark helpful conversations, not to be used as a weapon during performance reviews. When you get it right, it transforms performance tracking from a source of stress into a catalyst for growth.
The most effective scorecards are living documents. They should be reviewed regularly in team meetings and one-on-ones, providing a shared, objective starting point for discussing what's working, what's not, and how to improve.
Let’s look at a practical example. A scorecard for a SaaS sales development team really shines when it blends activity, quality, and outcome metrics to paint a complete picture.
Here’s what that might look like:
Example Scorecard for a SaaS Sales Development Team
| Metric Category | Specific Metric | Target | Purpose |
|---|---|---|---|
| Activity | Dials Per Day | 80 | Ensures consistent outreach effort. |
| Quality | Conversation-to-Meeting Rate | 10% | Measures the effectiveness of their pitch. |
| Outcome | Qualified Meetings Booked | 12/month | Connects daily activity to a direct business goal. |
| Business Impact | Pipeline Generated | $50k/month | Links their efforts directly to revenue. |
This multi-faceted view is brilliant because it prevents someone from gaming the system. A rep can't just make a hundred low-quality calls to hit an activity target, because their other metrics would suffer. It forces a balance between their effort, the quality of their conversations, and the actual business value they generate. This is how you build a scorecard that drives real, sustainable results.
Let’s Talk About Automating Your Productivity Tracking
Let’s be honest: manual data entry is a soul-crushing waste of time. When your managers and team members are spending hours every week just pulling reports and updating spreadsheets, they aren't doing the strategic work that actually moves the needle. This is where automation really changes the game.
By setting up automated tracking, you’re not just saving time. You’re cutting down on administrative busywork, getting rid of human error, and taking subjective guesswork out of the performance equation. The whole point is to create a smooth flow of information that helps your team, not bogs them down.
Use the Tools You Already Have
The best part is you probably don't need to buy a bunch of new software. The trick is to connect the tools you already use so the data flows directly into your scorecards without anyone having to lift a finger. Just think about where your team's work actually lives.
For most SaaS companies, the key systems are:
- Your CRM (like Salesforce): This is where you’ll find all the critical data for your sales and customer success teams. You can automatically pull metrics like deals closed, pipeline generated, and customer interaction frequency.
- Project Management Tools (like Jira or Asana): For your engineering and product folks, these tools are tracking everything from cycle time and deployment frequency to bug resolution rates.
- BI Platforms (like Tableau or Looker): These are fantastic for pulling data from all your different sources and building out those clean, easy-to-read scorecards we talked about.
The real power move is getting these systems to talk to each other. To truly streamline operations and get a clear picture of team productivity, a key step is understanding how to automate business processes from end to end. This is how you build a reliable, hands-off system for measuring what truly matters.
Automation turns productivity measurement from a weekly chore into a silent, background process. It makes sure the data is always fresh, accurate, and ready to spark your next strategic conversation.
A classic example I’ve seen work wonders is connecting Jira directly to a BI tool like Tableau. An engineering manager can then have a real-time dashboard showing key DevOps metrics. They never have to interrupt a developer to ask for a status update again.
Here’s what a typical Jira dashboard looks like—this is the kind of raw, automated data source you want to tap into.
This gives leaders an instant pulse on how projects are progressing, from sprint burndown to issue resolution times, all pulled automatically.
Another great integration is connecting Salesforce with a sales engagement tool like Outreach. This can automatically track how effective different email sequences are by measuring reply rates and meetings booked. It gives your sales leaders invaluable, real-time feedback on what’s actually working in the field. There are a ton of AI tools that can help with this, and we've actually covered some great options in our guide to AI automation for SaaS businesses.
Don't Forget the Human Element
Look, introducing any new kind of tracking can make people a little antsy. If you handle it the wrong way, automation can feel a lot like big brother is watching. That’s why how you roll this out is just as important as the technology itself.
Transparency is non-negotiable. You have to frame this as a tool to help everyone win, not as a way to micromanage.
Here’s a simple playbook for introducing it:
- Explain the "Why" First: Start by clearly communicating the purpose. Let everyone know the goal is to kill manual work, get better data, and free up their time for more interesting problems.
- Connect it to Team Goals: Remind everyone that these are the same metrics the team already agreed on. They’re tied directly to the business outcomes you’re all working toward together.
- Use Data for Coaching, Not Judging: Make it clear that these scorecards will be used to find opportunities for support, better training, and process improvements—not to call someone out for having a tough week.
When you automate the what (the data collection), you free up so much more time for the why (the strategic conversations). This shift helps you move from being a manager who just counts things to a leader who coaches and develops their people. And at the end of the day, that’s the whole point.
Turning Productivity Insights into Actionable Growth
Collecting data and building scorecards is a great start, but it's only half the journey. The real magic happens when you use those insights to make meaningful changes. Data sitting on a dashboard is just a missed opportunity; data that sparks action is what moves a SaaS business forward.
This is where your measurement system stops being a passive report card and becomes an active coaching tool. You're aiming to create a tight feedback loop: spot a trend, figure out the root cause, and roll out a targeted solution. This is how you turn abstract numbers into real business growth.
Diagnosing the Root Cause of a Productivity Dip
Let's walk through a situation I've seen countless times. Your customer success team’s scorecard shows a 15% drop in the "First Contact Resolution" rate over the last month. The data is telling you what happened, but it's not telling you why. This is where you, as a leader, need to put on your detective hat.
To really get this right, you have to embrace data-driven decision making. Instead of guessing or jumping to conclusions, you need to dig in. That dip in performance could come from a few different places:
- A Process Bottleneck: Did a recent change to the support workflow go sideways? Maybe a new escalation procedure is adding confusing steps and causing delays.
- A Training Gap: If you just launched a complex new feature, your team might not be fully prepared to handle the new kinds of questions rolling in.
- A Tooling Issue: Is the knowledge base out of date? Perhaps the CRM integration is lagging, forcing reps to hunt for customer info across different systems.
By asking these kinds of targeted questions, you can get past the symptom (the metric) and uncover the actual disease. This diagnostic step is absolutely critical—otherwise, you risk "fixing" the wrong problem.
From Diagnosis to Action with Simple Playbooks
Once you’ve pinpointed the real issue, it's time to build a clear plan of attack. This is where a simple, focused playbook can be a lifesaver. I'm not talking about a massive, 50-page document. I mean a straightforward guide that documents a best practice, outlines clear steps for improvement, and sets a date to check back in.
Let’s stick with our example. Your investigation uncovered a training gap around that new feature. Your playbook might look something like this:
- Objective: Get the First Contact Resolution rate for tickets about the new feature back to our 85% baseline within 30 days.
- Key Actions:
- Set up two hands-on training workshops with the product team.
- Create and share a one-page cheat sheet on common troubleshooting steps.
- Add three new articles to the internal knowledge base covering the feature's most frequent issues.
- Owner: The Customer Success Team Lead is on point to get this done.
- Re-evaluation Date: We'll review the metric in four weeks to see if our plan worked.
This simple structure turns a fuzzy problem into a concrete project with clear ownership. Building a library of these response plans for common issues is a total game-changer. For a deeper dive into this, check out our guide on building a customer success playbook.
The goal is to build a repeatable process for improvement. When your team sees a direct line from data to diagnosis to a helpful solution, they start to view metrics as a supportive tool for their own growth.
This approach also helps solve a much bigger problem that quietly kills performance: employee engagement. Globally, only 21% of employees are engaged at work, a gap that costs an estimated $438 billion in lost productivity each year. On top of that, it often takes new hires 8 to 12 months just to catch up to the productivity of their peers. By using data to provide targeted support, you fight disengagement and drastically shorten that ramp-up time, which can boost team productivity by as much as 11%. You can find more on these employee productivity statistics on Teamout.com.
Cultivating a Culture of Continuous Improvement
At the end of the day, measuring team productivity isn’t a one-and-done project. It’s an ongoing discipline. The real power of this system kicks in when you make it a central part of your team's regular conversations.
Make your scorecards the centerpiece of weekly team meetings and one-on-ones. And don't just fixate on the red numbers! Celebrate the green ones, too. When a metric improves, find out why. What did that person or team do differently? Their successes become teachable moments you can share with everyone.
This consistent, data-informed feedback loop does more than just fix problems. It builds a culture where everyone feels empowered to find opportunities, try out solutions, and own their results. You'll see the focus shift from top-down orders to collaborative problem-solving, creating a team that’s not only productive but also resilient and ready to innovate.
Got Questions About Measuring Team Productivity?

Even with the best framework in place, you’re bound to hit a few practical questions when you start measuring team productivity. It’s totally normal to run into roadblocks. Let’s tackle some of the most common ones I hear from leaders.
How Do You Measure Productivity for Creative Roles?
This is the classic question. How do you measure productivity for roles in R&D, design, or content where the output isn't just about cranking out widgets? The secret is to stop focusing on the quantity of output and start measuring the impact of outcomes.
Forget about counting how many articles someone wrote or designs they created. That’s a trap.
Instead, tie their work directly to business goals. For a product designer, you could track the user adoption rate of a new feature they helped build. For a content marketer, look at the MQL-to-SQL conversion rate coming from their blog posts.
It’s all about connecting creative work to real-world results. You can also round this out with qualitative feedback, like peer reviews or stakeholder satisfaction surveys, to get the full story.
What Are the Biggest Mistakes to Avoid?
Rolling out a new tracking system can go sideways fast. The absolute biggest mistake I see is a failure to communicate. If your team feels like they’re being spied on, you've lost before you’ve even started. You have to be transparent.
Here are a few other common tripwires:
- Chasing vanity metrics: Don't get fooled by numbers that look impressive but mean nothing. Things like "lines of code" or "emails sent" rarely tell you anything useful.
- Using a one-size-fits-all approach: The scorecard that works for your sales team is going to be useless for your engineers. You have to tailor your metrics to what each function actually contributes.
- Ignoring the data: The second biggest mistake is collecting all this data and then letting it gather dust. If you aren't using the insights to coach your team and make things better, the whole exercise is a waste of time.
The point of measurement should always be about getting better, not about passing judgment. When your team sees data as a tool for their own growth, they'll get on board. If they see it as a weapon for performance reviews, they'll push back.
How Often Should We Review Productivity Metrics?
The right review cadence really depends on the metric itself. Some numbers are useful to look at daily or weekly, while others only make sense on a monthly or quarterly basis. A good rule of thumb is to sync your review schedule with the natural rhythm of your business operations.
- Weekly Team Meetings: These are perfect for looking at short-term, tactical metrics like sales calls made or support tickets closed. It keeps everyone on the same page and lets you make quick course corrections.
- Monthly Business Reviews: This is where you zoom out a bit. Use this time to analyze bigger outcome metrics like net revenue retention or customer churn rate, connecting your team's day-to-day work to the company's overall performance.
- Quarterly Strategy Sessions: Now it’s time to really step back and ask the big questions. Are we still tracking the right things? Have our priorities shifted? Do we need to update our goals?
Don’t just set your metrics and forget about them. Your business is always evolving, and your metrics need to evolve with it. A consistent review cycle keeps your measurement system relevant and ensures it continues to drive the right behaviors. For a deeper dive, our guide on creating effective employee key performance indicators is a fantastic resource.