In the SaaS world, we throw around a lot of terms, but SaaS key performance indicators (KPIs) are the ones that really matter. Put simply, they are the numbers that tell you if your business is actually healthy. Think of them as the dashboard in your car—they give you the critical readouts on speed, fuel, and engine health so you know if you're cruising along or about to break down.
These metrics are your window into everything from revenue and customer loyalty to how efficiently your team is operating.
Why SaaS KPIs Are Your Business Compass

Trying to run a SaaS company without tracking KPIs is like trying to navigate a ship in a storm with no map and a broken compass. You're just guessing, and in this market, guessing gets you sunk. These aren't just abstract figures for a spreadsheet; they are the language of your business. They tell you a clear story about what’s working, what isn't, and where you're headed.
Without them, every decision is a shot in the dark. With them, you have a data-backed roadmap to guide your every move.
The Story Behind the Numbers
Every single KPI tells a piece of your company's story. They're all connected, and when you look at them together, you get a complete picture of your operations. When you start tracking the right metrics, you stop just reacting to problems and start proactively building the future you want.
These numbers answer the big questions that keep every operator up at night:
- Financial Health: Are we actually building a profitable, sustainable business here?
- Customer Value: Do our customers love us, and are we attracting more people like them?
- Growth Potential: Is our growth engine built to last, or is it going to sputter out?
For instance, a high Customer Acquisition Cost (CAC) might look scary on its own. But if you see it next to a fantastic Customer Lifetime Value (LTV), it suddenly tells a very different, much happier story about a profitable growth strategy. It's all about understanding how these numbers talk to each other.
A great rule of thumb for a healthy SaaS business is an LTV to CAC ratio of 3:1 or better. This means for every dollar you spend to bring in a new customer, you should be getting at least three dollars back over their time with you.
Guiding Your Strategic Decisions
At the end of the day, tracking KPIs is all about making smarter, faster decisions. They give you the clarity you need to put your resources in the right places, fix broken processes, and steer your company toward real, sustainable growth. If you want to dive deeper into choosing the right metrics, check out our guide on the essential SaaS KPIs.
Think of this guide as your map. We’ll walk through the must-know metrics for any SaaS leader, like Monthly Recurring Revenue (MRR), Customer Churn, CAC, and LTV. By the time you're done, you won't just understand the numbers—you'll know how to use them with confidence.
Measuring the Engine of Growth
If recurring revenue is the lifeblood of your SaaS business, your growth engine is the heart that pumps it. But how do you know if that heart is healthy and efficient? You need to measure exactly how much it costs to get a new customer in the door.
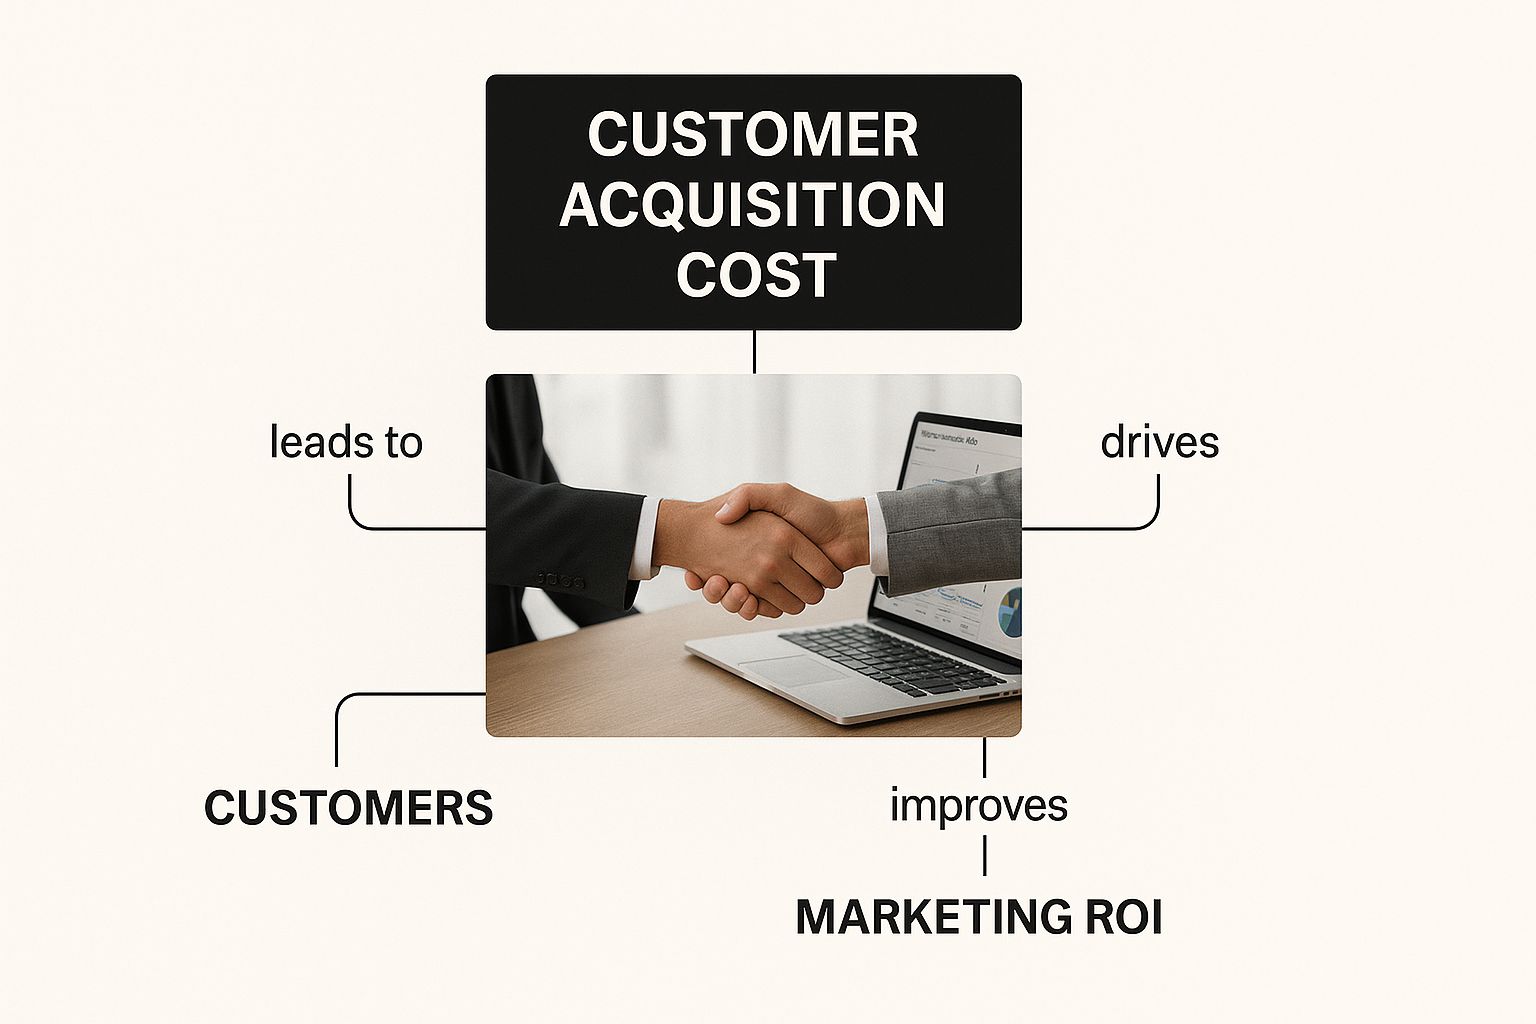
That's where Customer Acquisition Cost (CAC) comes in. It’s the single most important metric for understanding the efficiency of your growth.
Think of it this way: CAC is the total bill for winning a single new customer. It rolls up every dollar you spend on sales and marketing—from Google Ads and content marketing to your sales team's salaries and commissions—and gives you a simple, powerful number.
How to Calculate Your Customer Acquisition Cost
The math for CAC is refreshingly simple. Just take your total sales and marketing expenses for a specific period (like a quarter or a year) and divide it by the number of new customers you signed up in that same timeframe.
The Formula:
Total Sales & Marketing Spend / New Customers Acquired = Customer Acquisition Cost
Let's walk through a quick example. Imagine your company spent $50,000 on sales and marketing in the first quarter. During that time, you brought on 100 new paying customers.
Your calculation would look like this:
- $50,000 (Total Spend) / 100 (New Customers) = $500 CAC
So, it cost you an average of $500 to acquire each of those customers. But here's the crucial question: Is $500 a good number or a bad one? On its own, it’s meaningless. Its value comes from how it stacks up against the revenue that customer brings in.
The All-Important LTV to CAC Ratio
This brings us to one of the most vital relationships in all of SaaS: the link between CAC and Customer Lifetime Value (LTV). LTV is the total amount of revenue you can expect from a customer over the entire time they stay with you. When you compare it to your CAC, you get a clear picture of your business model's health.
A healthy LTV to CAC ratio is the ultimate sign of a sustainable business. For instance, if your LTV is $1,500 and your CAC is $500, your ratio is 3:1. This is the gold standard for a growing SaaS company. It means for every dollar you put into acquiring a customer, you're getting three dollars back over time.
Now, flip that around. If your LTV is only $400 and your CAC is $500, your ratio is less than 1:1. You're officially losing money on every new customer you sign. That’s a recipe for disaster. This delicate balance is why so many successful companies target that 3:1 ratio—it ensures they have enough margin to cover costs and fuel future growth.
Actionable Ways to Get Your CAC Under Control
Keeping a close eye on your CAC is essential for scaling without burning through your cash. A high CAC can kill your momentum, even if you’re pulling in a lot of revenue. The goal isn't just about spending less; it's about making every dollar you spend work smarter.
Here are three proven strategies for optimizing your CAC:
- Double Down on Your Best Channels: Don't just throw your marketing budget at every platform. Dig into your data to see which channels—SEO, paid ads, content, social media—are actually delivering the best customers for the lowest cost. Then, shift your resources to what's working and cut the dead weight.
- Improve Sales Team Efficiency: Give your sales team the tools, training, and high-quality leads they need to close deals faster. The shorter your sales cycle, the less time and money you spend on each new customer, which directly lowers your CAC.
- Lean into Product-Led Growth (PLG): Let your product do the selling for you. By offering a freemium version or a robust free trial, you allow potential customers to see the value for themselves before they ever talk to a salesperson. This can slash acquisition costs and become your most powerful growth lever.
By constantly tracking and working to improve your CAC, you ensure your growth engine is running efficiently, not just fast. This focus on profitable growth is just as fundamental as understanding your Annual Recurring Revenue, which measures the overall financial stability of your business.
2. Your Revenue Lifeline: MRR and ARR
Bringing in new customers is exciting, but it's the recurring revenue that truly keeps a SaaS business healthy. This is your predictable income stream, the very reason the subscription model is so powerful. Let's break down the two most important metrics for tracking this financial pulse: Monthly Recurring Revenue (MRR) and Annual Recurring Revenue (ARR).
Think of MRR as a normalized, month-to-month snapshot of your predictable revenue. It smooths out the noise from different contract lengths, one-time fees, and billing cycles, giving you a clean look at your company's momentum. ARR is just the bigger picture view of that—simply your MRR multiplied by 12.
The Leaky Bucket Analogy
The best way to understand MRR is to picture your business as a bucket of water. The water level is your total MRR.
Every month, you have new water coming in from faucets and old water draining out through leaks. Your job is simple: fill the bucket faster than it leaks. This analogy helps break MRR down into its core pieces, with each one telling a vital part of your growth story.
The image below shows how all these different pieces, like the cost to acquire a customer, fit into the bigger revenue picture.
As you can see, there’s a critical balancing act between what you spend to get a customer and what they pay you over time. This dynamic directly feeds into the health of your recurring revenue.
The Three Faucets of MRR Growth
Your revenue doesn’t just show up from a single source. It’s a mix of winning new business, growing existing accounts, and, unfortunately, losing some customers along the way. When you track each of these streams separately, you get a much clearer idea of what's really driving your growth.
You need to keep an eye on three main types of MRR:
- New MRR: This is the fresh water pouring into your bucket. It’s all the recurring revenue from brand-new customers you signed in a given month. It’s a pure measure of how well your sales and marketing efforts are working.
- Expansion MRR: This is your most efficient growth engine. It’s the extra MRR you get from existing customers when they upgrade their plan, add more seats, or buy an add-on. A high expansion MRR is a fantastic sign that your product is delivering value and customers are growing with you.
- Churned MRR: This is the leak. Churned MRR is the revenue you lose when customers cancel their subscriptions or downgrade to a cheaper plan. It’s a direct signal of customer unhappiness or a sign that your product isn't fitting their needs anymore.
Looking at these three together gives you your Net New MRR, which is the truest measure of your growth for the month.
Net New MRR = (New MRR + Expansion MRR) – Churned MRR
If your Net New MRR is positive, your bucket is filling faster than it's draining. You're on the right track. But if it's negative, it's a huge red flag that churn is killing your growth.
Why This Matters So Much
Tracking MRR and ARR isn't just about accounting. It’s the bedrock of smart, strategic planning.
These numbers give you the power to forecast future revenue, which helps you decide everything from who to hire next to what features to build. A stable, growing MRR is exactly what investors want to see—it’s proof you have a business model that can scale.
When you can predict your income, you can make confident bets on growth. You stop putting out fires and start building a data-driven strategy. That predictability is what separates a scrappy startup from a well-oiled SaaS machine.
This financial clarity is also tied to other key metrics. For example, a customer's recurring revenue is a core component of their long-term value. To see how these concepts connect, check out our deep dive on how to calculate customer lifetime value in SaaS.
Plugging Leaks with Retention and Churn Metrics
While landing new customers feels like a win, it’s only half the battle. The SaaS companies that truly dominate are the ones obsessed with keeping the customers they’ve already earned. This brings us face-to-face with one of the most destructive forces in any subscription business: customer churn.
Think of your company as a bucket you’re trying to fill with recurring revenue. It doesn't matter how fast you pour new MRR in if there are holes in the bottom. Churn is that leak. It's constantly draining your progress, forcing you to run faster and faster just to stay in the same place.
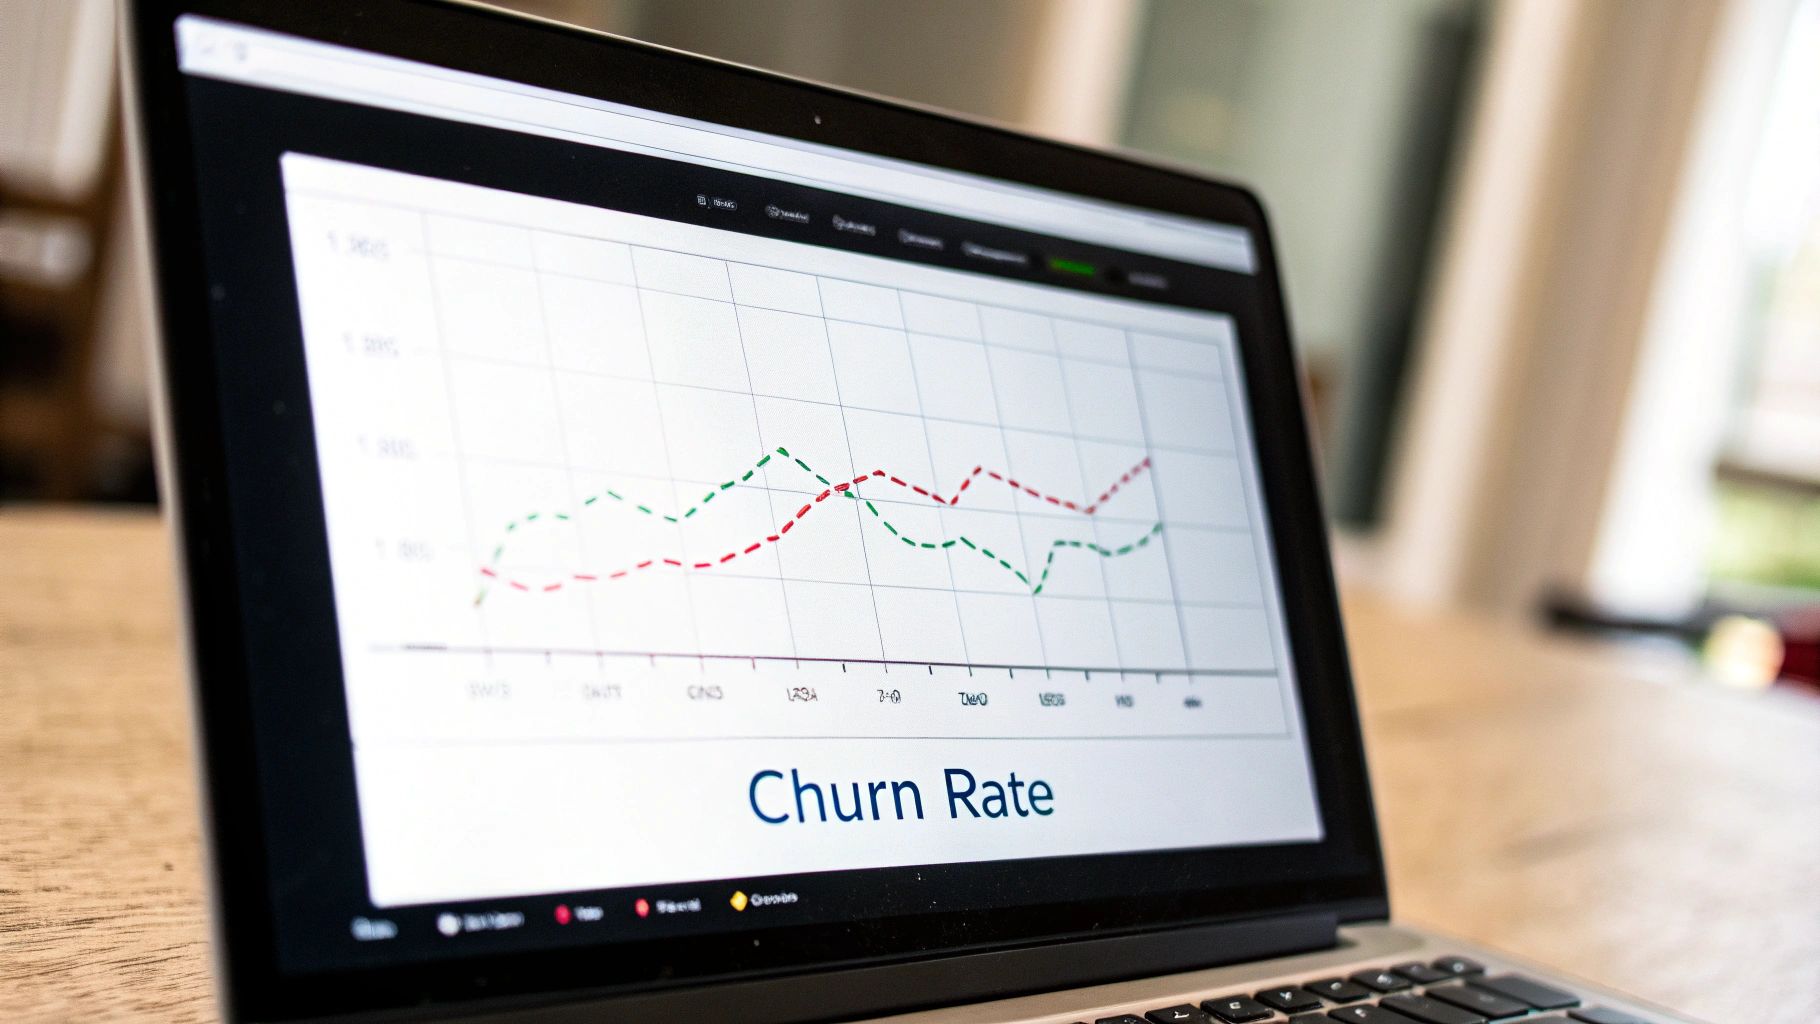
What is Customer Churn Rate?
Churn Rate is the metric that tells you what percentage of your customers are canceling their subscriptions over a set period. It’s a brutally honest reflection of customer happiness and how much value your product delivers.
If customers are heading for the exits, it’s a massive red flag that something is fundamentally wrong.
Calculating your basic customer churn is simple enough:
(Customers Lost in Period / Customers at Start of Period) x 100 = Customer Churn Rate %
For instance, if you started the month with 500 customers and 25 of them canceled, your monthly churn rate is 5%. But this number, as crucial as it is, doesn't paint the full picture of the financial damage.
The Critical Difference Between Customer and Revenue Churn
Let's be real—not all customers are created equal. Losing a small startup on your basic plan stings a little. Losing an enterprise client with hundreds of seats is a whole different kind of pain.
This is exactly why you have to track Revenue Churn, which measures the actual MRR you lost from those canceled accounts.
Here’s a simple way to think about it:
- Customer Churn tells you how many logos you lost.
- Revenue Churn tells you how much money walked out the door.
You might even see a low customer churn rate but a dangerously high revenue churn rate. This is a five-alarm fire. It means your most valuable, highest-paying customers are leaving, signaling your product might be failing to meet the needs of your ideal customer profile.
The Massive Financial Impact of Retention
Fighting churn isn't just about playing defense; it’s one of the most powerful ways to grow your profits. Industry data shows that a healthy, mature SaaS company should aim for an annual churn rate between 5% and 7%. For smaller or newer companies, that number can easily spike to 20% or more.
The impact here is huge. Studies have shown that even a 5% improvement in churn can boost profits by up to 95%. Why? Because of the compounding power of recurring revenue. You can find more SaaS statistics and benchmarks to learn about the compounding effects of retaining revenue on Zylo.com.
"The most important thing for every SaaS company is to retain existing customers while also onboarding new ones. If your typical customer does not stick around long enough for you to earn back what you spent to acquire them (CAC), then you're in trouble."
Once you have a solid handle on measuring churn, implementing proven strategies to reduce customer churn is the essential next step for long-term growth.
Practical Strategies to Reduce Churn
You'll never get churn down to zero, but you absolutely can and should fight it. Lowering your churn rate demands a proactive, customer-first mindset that begins the moment a user signs up.
If you’re looking for a deep dive, check out our dedicated guide on how to reduce your churn rate.
For now, here are three high-impact areas to focus on immediately:
- Nail Your Onboarding: The first few moments a customer spends with your product are everything. A smooth, guided onboarding that helps them get their first "win" as quickly as possible is your best defense against early churn.
- Engage At-Risk Users Proactively: Use your product analytics to spot users whose engagement is dipping. Don't wait for them to cancel. Reach out with helpful tips, offer a quick training session, or just ask for feedback before they're gone.
- Listen and Act on Feedback: Make it easy for customers to tell you what they think through surveys, interviews, and support tickets. But the most important part is showing them you're listening by actually using their insights to build a product they can't live without.
Gauging Customer Value and Engagement
Getting customers in the door and keeping them from leaving is just the start. The real goal? Maximizing how much value each customer brings to your business over the long haul. This is where you start connecting the dots between how much you spend to get a customer, how long they stick around, and how profitable they actually are.
Two key SaaS metrics give you this deeper insight: Customer Lifetime Value (LTV) and the Customer Engagement Score. Think of it this way: LTV predicts the future, while an engagement score helps you influence it. Together, they give you a clear picture of customer health and your company's true potential.
Calculating Customer Lifetime Value
Customer Lifetime Value (LTV), sometimes called CLV, is the total revenue you can reasonably expect from a single customer over their entire time with you. It’s a forecast that answers the crucial question: "What is a customer really worth?" It’s not about one month's payment; it's about the whole relationship.
A high LTV is fantastic news. It tells you that your product is delivering real, sustained value and your customers are loyal. It’s also the number that justifies your marketing spend. If you know a customer will bring in $3,000 over their lifetime, spending $500 to acquire them suddenly looks like a brilliant investment, not a cost.
LTV is arguably the most strategic metric in SaaS. It informs your pricing, marketing budget, sales strategy, and retention efforts. Without a clear picture of LTV, you’re flying blind on the true profitability of your customer base.
Calculating LTV can get complicated, but a simple version gives you a powerful starting point. You just need two other numbers you should already be tracking: your Average Revenue Per Account (ARPA) and your Customer Churn Rate.
The Simplified Formula:
Average Revenue Per Account (ARPA) / Customer Churn Rate = Customer Lifetime Value
Let's walk through an example. Imagine your customers pay an average of $100 per month (your ARPA). You also know you lose about 5% of your customers each month (your churn rate).
The math looks like this:
- $100 (ARPA) / 0.05 (Churn Rate) = $2,000 LTV
This means, on average, you can expect a new customer to generate $2,000 in revenue before they eventually leave. That single number is incredibly valuable for making smart financial decisions.
Measuring the Customer Engagement Score
While LTV is all about the money, the Customer Engagement Score (CES) is a proactive health check. It's your early warning system, helping you spot customers who are drifting away long before they show up in your churn report.
There isn't a universal formula for CES. Instead, it’s a custom score you build based on the key actions that signal a healthy, active user of your specific product. You're defining what "good" looks like for your customers.
To create a CES, you assign weighted values to important user behaviors. These might include:
- Logins: How often are they actually using the platform?
- Feature Adoption: Are they using the sticky, high-value features?
- Support Tickets: Are they asking questions? (This isn't always bad; it can show they're engaged).
- Team Invitations: Are they bringing their colleagues into the tool? A great sign.
- Session Duration: How long do they stick around when they log in?
You add up the points for each action to get a customer's total score. A rising score might signal a perfect time for an upsell conversation. A falling score is a red alert for your customer success team to jump in and help before it's too late. To dig deeper into the metrics behind these interactions, you can explore these essential customer support KPIs.
Ultimately, tracking these metrics helps you shift from being reactive to proactive. You stop wondering why customers leave and start understanding what makes them stay, grow, and become your most valuable assets.
How to Build Your SaaS KPI Dashboard
Tracking individual SaaS metrics is a solid first step, but the real magic happens when you bring them all together. A well-built KPI dashboard turns a bunch of isolated numbers into a clear, cohesive story about the health of your business. It helps you move from just collecting data to actually using it to make smart, strategic moves.
Think of your dashboard as the flight deck of your company. Each gauge—MRR, Churn, LTV—is a critical instrument. When you can see them all on one screen, you start to understand how they influence each other, letting you steer your company with much more confidence.
Choosing the Right Metrics for Your Stage
Your dashboard isn't a "one-size-fits-all" solution. It has to grow and change right along with your company. The KPIs that are mission-critical for a brand-new startup are often just noise for a mature enterprise.
-
Early-Stage Startups: It's all about validation. Are you on the right track? Your main focus should be on product-market fit and how people are actually using your product. This means prioritizing metrics like daily active users, feature adoption rates, and customer feedback scores over pure financial efficiency.
-
Growth-Stage Companies: Now, the focus shifts to building a growth engine that's both sustainable and efficient. This is where metrics like the LTV to CAC ratio, Net New MRR, and churn rate become absolutely essential. You're trying to build something that can scale profitably.
-
Mature Enterprises: At this point, the game is about optimization and expanding your footprint. Your dashboard should shine a spotlight on metrics like Net Revenue Retention (NRR), expansion MRR from different customer groups, and overall profitability.
A classic mistake is jamming a dashboard with every single metric you can think of. A truly effective dashboard tells a clear story with a handful of vital signs, not a confusing novel with dozens of data points. Always prioritize clarity over quantity.
Selecting Your Dashboard Tools
Once you know what you need to track, you have to figure out how you're going to track it. The right tool for the job really depends on your budget, your team's technical skills, and how complex your data is. For many companies, building out effective business scorecards and dashboards is a pivotal operational project.
Here are a few common routes teams take:
-
Spreadsheets (Google Sheets, Excel): This is the simplest place to start. Spreadsheets are free and incredibly flexible, but they can quickly become a massive headache to manage and are often prone to human error as your business grows.
-
SaaS-Specific Analytics Platforms: Tools like ChartMogul or Baremetrics were built from the ground up for subscription businesses. They plug directly into your payment systems to automatically and accurately calculate things like MRR and churn.
-
Business Intelligence (BI) Tools: Platforms such as Tableau or Looker offer the most raw power and customization. They can pull data from all over your company to create a single source of truth, but they usually require a lot more technical know-how to get set up and maintain.
Frequently Asked Questions About SaaS KPIs
Alright, let's get into some of the real-world questions that pop up once you start digging into SaaS metrics. Knowing the definitions is one thing, but knowing how to apply them to your business is where the magic happens.
Let's tackle a few common ones I hear all the time.
How Often Should I Track My SaaS KPIs?
This is a great question, and the answer isn't the same for every metric. You don't need to obsess over every single number every single day. The trick is to match your tracking schedule to the metric's purpose.
Think of it like driving a car. You're constantly glancing at your speedometer, but you probably only check your tire pressure once a month. It’s the same with your business dashboard.
- Daily Check-ins: Look at things like daily active users (DAU) and new trial sign-ups. These are your immediate pulse checks—they tell you if people are showing up and kicking the tires.
- Weekly Reviews: Metrics like customer engagement scores or support ticket volume are perfect for a weekly review. This helps you see trends in user happiness without getting bogged down by a single good or bad day.
- Monthly Deep Dives: This is where you sit down with the big financial numbers. MRR, Customer Churn, and CAC need a month's worth of data to smooth out the noise and show you the real trajectory of your business.
What Is The Most Important KPI For an Early-Stage Startup?
When you're just starting out, your single biggest mission is to find product-market fit. Forget about optimizing for profit just yet. Before you can build a big business, you have to prove people actually want and use what you've built.
While LTV and CAC will become your best friends later on, a brand-new startup needs to be obsessed with engagement. You have to prove your product solves a real problem for a real audience first. Strong, consistent usage is the earliest sign you're onto something big.
So, put your energy into tracking KPIs like Daily Active Users (DAU), feature adoption rates, and straight-up customer feedback. These numbers tell the true story of whether you're creating value. Get that right, and the financial metrics will follow.
How Can I Improve My LTV to CAC Ratio?
This is the million-dollar question for any scaling SaaS company. Improving your LTV:CAC ratio boils down to two things: making each customer more valuable over time or spending less to get them in the door. The best companies do both.
Here are a few places to start:
- Optimize Your Pricing: Don't just set your prices and forget them. Are your tiers aligned with the value customers get? A simple pricing tweak can have a massive impact.
- Double Down on Retention: The easiest way to increase LTV is to stop the bleeding. Investing in a great onboarding experience and a proactive customer success team will keep churn down and your customers happy.
- Refine Your Acquisition Channels: Figure out which marketing channels bring you your best customers, not just the most customers. Pour your budget into what’s working and cut what’s not.
At SaaS Operations, we've built the playbooks and templates to help you create scorecards that actually work. We'll help you focus on the right metrics at the right time to accelerate your growth. Learn more about our frameworks.