The Rule of 40 is one of those back-of-the-napkin metrics that’s deceptively simple but incredibly powerful. At its core, it's a quick health check for a software-as-a-service business, designed to answer one critical question: are you balancing growth with efficiency?
The rule states that your revenue growth rate plus your profit margin should add up to 40% or more. This simple formula provides a clear signal on whether you are building a sustainable, high-value company or just burning cash for growth that won't last.
So, What Exactly Is the Rule of 40?
Think of it as a gut-check for your entire strategy. Are you building a drag racer that burns through cash for a spectacular burst of speed, or are you engineering an efficient machine built for a long-distance race? The Rule of 40 is the gauge that tells you which one you've got.
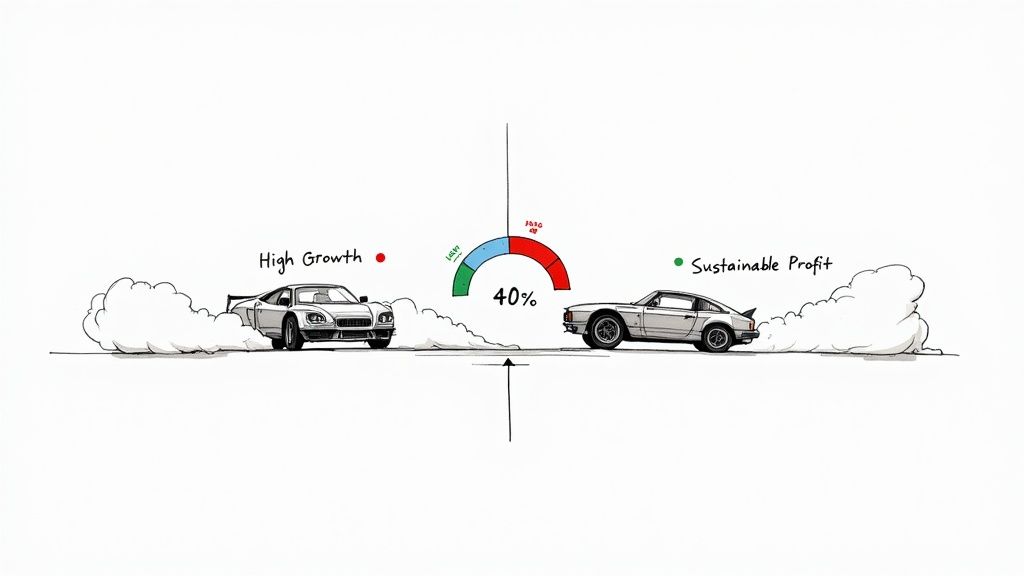
It combines two make-or-break priorities that are often at odds with each other:
- Speed (Growth): How fast are you growing your recurring revenue? This is you hitting the accelerator.
- Efficiency (Profitability): How much cash does your operation generate (or consume)? This is your fuel economy.
Instead of drowning in dozens of different KPIs, this single number cuts through the noise. It gives everyone—from founders to operators to investors—a clear signal about whether the company’s capital allocation strategy is actually working.
A Quick Backstory
The Rule of 40 gained prominence in the SaaS world around 2015, popularized by venture capitalist Brad Feld. He observed that private equity investors and public markets were using it as a primary benchmark to assess the health and valuation of software companies.
The core insight is that there's a healthy trade-off. A business growing at a blistering 60% year-over-year can afford a -20% profit margin. In contrast, a more mature company growing at 10% needs a healthy 30% profit margin to be considered a top performer. Both scenarios achieve the 40% target and represent well-run businesses at different stages.
"Annual Recurring Revenue is the North Star, but expanding your margins is how you win.”
The Rule of 40 doesn't prescribe one way to build a great SaaS company; it validates that your chosen path—whether high-growth or high-efficiency—is creating value.
Rule of 40 Scenarios at a Glance
To make this tangible, here are common SaaS profiles and how they stack up. Use this table to diagnose your own company's current state.
| Company Profile | Growth Rate | Profit Margin | Rule of 40 Score | Verdict & Next Step |
|---|---|---|---|---|
| High-Growth Startup | 70% | -25% | 45% | Healthy. Capital is being deployed effectively for growth. Maintain focus on efficient acquisition. |
| Growth-at-all-Costs | 50% | -30% | 20% | Unhealthy. The "burn multiple" is too high. Action: Analyze unit economics (LTV:CAC) immediately. |
| Balanced Performer | 25% | 20% | 45% | Healthy. The ideal state for a scale-up. Action: Explore reinvesting a few margin points to accelerate growth. |
| Mature & Profitable | 10% | 35% | 45% | Healthy. A cash cow. Action: Protect margins while seeking new product lines or markets for incremental growth. |
| Stagnant Player | 5% | 10% | 15% | Unhealthy. Lacks both momentum and efficiency. Action: Requires a strategic reset on either product or GTM. |
As you can see, there are multiple paths to a great score. It’s all about the strategic trade-offs you make.
Why Operators Can't Ignore This Metric
For those of us in the trenches of SaaS operations, this isn't just a fancy metric for a board deck. It’s a framework for our toughest decisions.
Should we hire three more account executives to chase an aggressive growth target? Or should we delay those hires and focus on optimizing cloud spend to improve our bottom line? The Rule of 40 forces you to quantify the impact of these choices on your overall business health.
Of course, to use this rule effectively, you must have pristine data hygiene. You can’t get an accurate Rule of 40 score without mastering core SaaS metrics like retention and ARR. A solid understanding of your company's annual recurring revenue is non-negotiable—it's the foundation this entire calculation is built on.
Calculating Your Rule of 40 Score Correctly
Getting your Rule of 40 score is simple arithmetic. The challenge lies in ensuring the inputs are accurate and consistent. Here is a step-by-step process to ensure you get a number you can trust.
The formula itself couldn't be easier:
Growth Rate (%) + Profit Margin (%) = Rule of 40 Score
The key to an actionable score is process. You must define your inputs and stick to them every time you measure, whether it's monthly for an internal pulse check or quarterly for a board meeting.
Step 1: Nail Down Your Growth Rate
For any subscription business, the gold standard for growth is Year-over-Year (YoY) Annual Recurring Revenue (ARR) Growth. Using total revenue can be misleading, as it includes one-time professional services or setup fees that don't reflect the core health of your subscription engine. ARR cuts through that noise.
Here is the exact playbook to calculate it:
- Find Your Starting ARR: Pull your ARR from the last day of the same month in the prior year (e.g., ARR on March 31, 2023).
- Find Your Current ARR: Pull your ARR from the last day of the most recently completed month (e.g., ARR on March 31, 2024).
- Calculate the Change: (Current ARR – Starting ARR) / Starting ARR
- Convert to Percentage: Multiply the result by 100.
This percentage is the first half of your formula. It is one of the most critical SaaS key performance indicators you can track.
Step 2: Define Your Profit Margin
This is where operators often get tripped up. While you could use different profit metrics, the industry standard for the Rule of 40 is the EBITDA Margin. However, for a truer measure of financial health, many top-tier operators and investors prefer the Free Cash Flow (FCF) Margin.
- EBITDA Margin: Focuses on operational profitability by excluding non-cash expenses like depreciation. It’s calculated as
(EBITDA / Total Revenue) * 100. - FCF Margin: Measures the actual cash your business generates after accounting for capital expenditures. It’s calculated as
(Free Cash Flow / Total Revenue) * 100.
Our recommendation: Use FCF Margin. It's a more honest reflection of your business's ability to self-sustain. A positive EBITDA can easily hide a negative cash flow situation.
Whatever you choose, use the same time period (e.g., Trailing Twelve Months) for your revenue and profit figures that you used for your growth calculation to ensure an apples-to-apples comparison. For more on the metric's history, see this crucial metric on Wikipedia.
Putting It All Together: Two Real-World Examples
Let's see how this works for two different SaaS companies.
Example 1: The VC-Backed Hyper-Growth Company
This startup is burning cash to dominate a new market category.
- Last Year's ARR: $2 million
- This Year's ARR: $3.4 million
- Total Revenue (TTM): $3.5 million
- EBITDA (TTM): -$700,000 (a loss)
First, the growth rate:
($3.4M – $2M) / $2M = 0.7, which is a 70% Growth Rate.
Now for the profit margin:
(-$700,000 / $3.5M) * 100 = -20% EBITDA Margin.
Finally, the Rule of 40 score:
70% + (-20%) = 50%. Despite the cash burn, their investment in growth is paying off handsomely, creating significant enterprise value.
Example 2: The Bootstrapped Scale-Up
This company prioritizes sustainable, profitable growth.
- Last Year's ARR: $8 million
- This Year's ARR: $10 million
- Total Revenue (TTM): $10.5 million
- EBITDA (TTM): $2.625 million
Let's run the numbers on their growth:
($10M – $8M) / $8M = 0.25, or a 25% Growth Rate.
And their profit margin:
($2.625M / $10.5M) * 100 = 25% EBITDA Margin.
And for their Rule of 40 score:
25% + 25% = 50%. This company is also in elite territory, achieving the same benchmark through a balanced, highly efficient approach.
Benchmarking Your Score Against Other SaaS Companies
You've calculated your score. Now, what does it actually mean? A score that's excellent for a seed-stage startup could be a red flag for a public company. Context is everything.
The Rule of 40 is a dynamic benchmark that evolves as your company matures. Understanding where you stand relative to your peers is crucial for setting realistic targets and managing investor expectations.
How Expectations Change as You Grow
For early-stage companies (<$1M ARR), growth is king. A score of 30% driven by 50% growth and a -20% margin is perfectly acceptable; it's a strategic investment in capturing market share.
Once you cross the $10M ARR mark, the balance shifts. Efficiency and scalability become paramount. An operator at this stage might still target a 40%+ score, but the composition would look different—perhaps 30% growth and a 10% profit margin.
This infographic breaks down that fundamental balance.
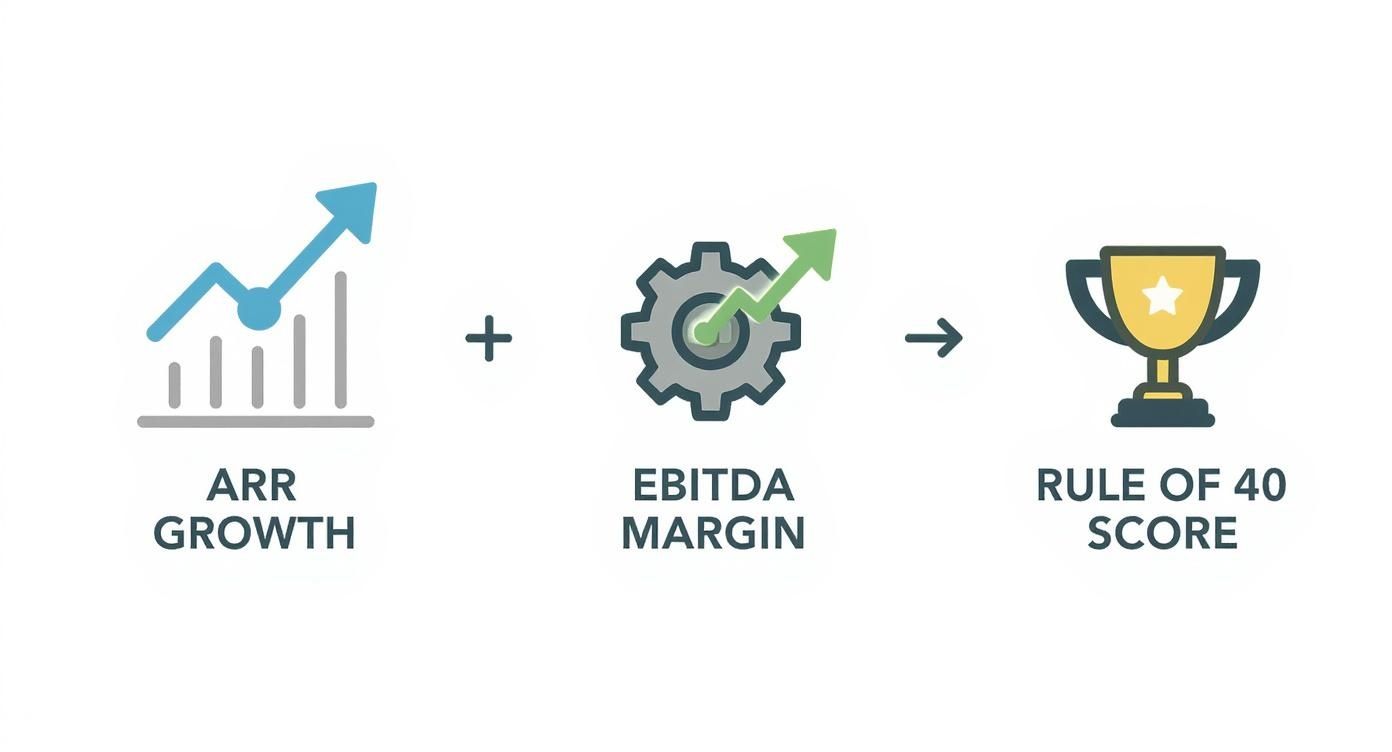
This visual captures the core trade-off: your growth engine and operational efficiency combine to produce a single number that validates your strategic direction.
Rule of 40 Benchmarks by Company Stage (ARR)
To provide a concrete yardstick, here are median Rule of 40 benchmarks based on data from numerous SaaS companies. Use this table to see how you compare to top performers at your scale.
| ARR Stage | Typical Growth Rate Range | Typical FCF Margin Range | Median Rule of 40 Score |
|---|---|---|---|
| <$1M | 50% – 100%+ | -50% to -20% | <40% (often accepted) |
| $1M – $5M | 40% – 70% | -25% to 0% | ~35% |
| $5M – $20M | 25% – 50% | -10% to 15% | ~40% |
| $20M – $50M | 20% – 35% | 10% to 25% | ~45% |
| $50M+ | 15% – 25% | 20% to 30%+ | >45% |
The trend is clear: as companies scale, the emphasis shifts from pure growth toward a balance with strong, predictable profitability. Visualizing these trends is key; review these high-impact SaaS dashboard examples for inspiration.
What to Do with Your Score: An Actionable Playbook
Benchmarking isn't an academic exercise; it's the trigger for strategic action. For a deeper look at how this fits with other indicators, see our complete guide to SaaS metrics benchmarks.
Here's a playbook for your next steps based on your score:
- You're Below the Benchmark: This is a signal to dig into your unit economics. Is the problem a leaky bucket (high churn), an inefficient GTM motion (high CAC payback), or bloated operational spending? Your LTV:CAC ratio is the first place to look.
- You're Meeting the Benchmark: You have a healthy, well-run business. Now it's about optimization. Can you reinvest 5% of your margin into a specific marketing channel to increase growth by 7-8%? Run small experiments to find your next lever for improvement.
- You're Exceeding the Benchmark: You are in the top decile and have strategic options. This is the time to be aggressive: expand into a new market, make a strategic acquisition, or significantly increase R&D investment to widen your competitive moat.
Benchmarking turns this metric into a powerful strategic compass, giving you the story behind the number and a clear direction for what to do next.
Avoiding the Common Rule of 40 Traps
The Rule of 40 is a powerful heuristic, but it's not infallible. Relying on it blindly is like driving a car by only looking at the speedometer. It tells you your speed but nothing about the engine's health or how much fuel is left.
To use this metric effectively, you must understand its limitations and avoid these common traps.
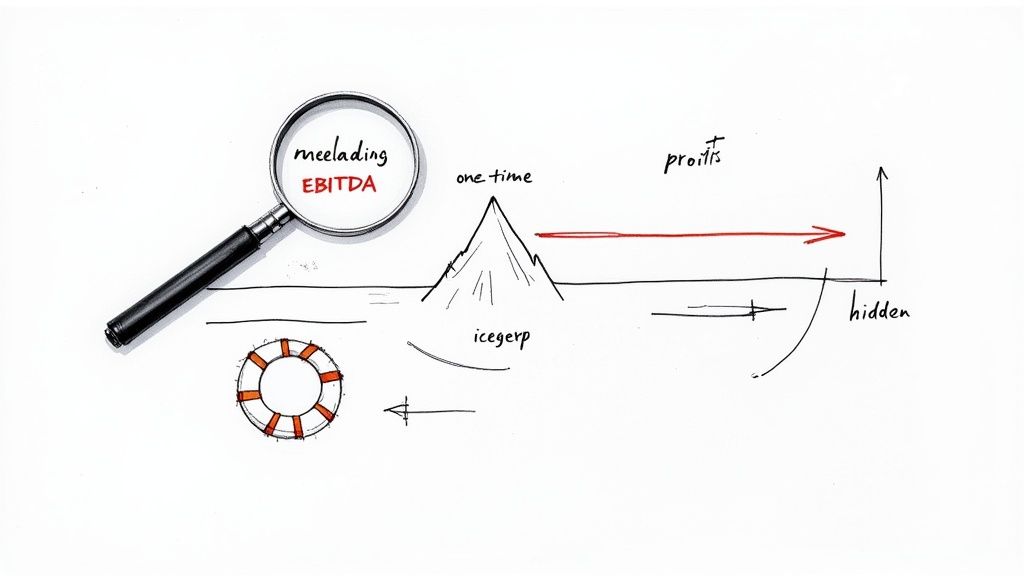
The EBITDA Margin Trap
EBITDA is the most commonly cited profit metric for the Rule of 40. The problem? It can be misleading. EBITDA adds back non-cash expenses and ignores changes in working capital and capital expenditures, painting a rosier picture of profitability than your bank account reflects.
A company can have a great EBITDA margin while burning through cash.
Actionable Insight: Prioritize Free Cash Flow (FCF) Margin over EBITDA Margin for a more honest assessment of your financial health. FCF is the cash your business generates and is a much better proxy for sustainable operations.
The Timing Mismatch Trap
A frequent and critical error is comparing mismatched timeframes. You cannot use your Trailing Twelve Months (TTM) growth rate with your most recent quarterly profit margin. This is an apples-to-oranges comparison that invalidates the result.
Actionable Insight: Enforce a strict data policy. Always use the same measurement period—preferably TTM to smooth out seasonality—for both your growth rate and your profit margin calculation.
You must also be vigilant about one-time events that can distort your score, such as a large multi-year deal paid upfront or a drastic, temporary cut to the marketing budget. Your goal is to measure the repeatable, underlying health of the business, not temporary jolts.
Ignoring Revenue Quality
This is the most dangerous trap of all. Not all revenue is created equal. A company can hit a 45% Rule of 40 score, but if its annual customer churn is 25%, that growth is unsustainable. It's a leaky bucket.
High churn forces your sales and marketing teams onto a hamster wheel, sprinting just to replace the revenue walking out the door. It's a clear signal of poor product-market fit or a failed customer success motion.
Actionable Insight: Always analyze your Rule of 40 score alongside retention metrics. Specifically, look at Net Revenue Retention (NRR). An NRR above 120% with a Rule of 40 score of 35% is far healthier than a 45% score with an NRR of 85%.
A truly durable SaaS business doesn't just grow fast; it grows efficiently with happy customers who stay and expand their usage over time.
Putting the Rule of 40 into Action
https://www.youtube.com/embed/EHzn1cnFcv8
A metric is useless unless it drives action. The real value of the Rule of 40 comes when you embed it into your company’s operating rhythm to make smarter, faster decisions. This is how you turn a number on a spreadsheet into a strategic weapon.
Making the Rule of 40 a Core KPI
The first step is to elevate its visibility. Add the Rule of 40 to your primary executive dashboard, right alongside ARR, NRR, churn, and CAC Payback Period. When the entire leadership team sees this number monthly, it becomes part of the shared language.
Next, integrate it into your goal-setting framework, such as Objectives and Key Results (OKRs).
An example of a powerful OKR:
- Objective: Achieve a best-in-class balance of growth and efficiency.
- Key Result 1: Maintain a Rule of 40 score above 45% throughout Q3.
- Key Result 2: Increase YoY ARR growth from 30% to 35% by improving lead conversion.
- Key Result 3: Improve FCF margin from 10% to 15% by reducing cloud infrastructure costs.
This framework forces every department to understand how their initiatives contribute to the company's overall strategic balance.
A Decision Framework for When Your Score Dips
A drop in your score is not a failure; it's a signal to diagnose the root cause. Use this simple framework to guide your response.
A dip in your Rule of 40 score is an invitation to ask critical questions: Is our growth engine sputtering, or is our operational spend getting out of control? The score tells you what to look at, not what to do.
- Is the dip caused by slowing growth? If your profit margin is stable but your growth rate has declined, it's time to focus on the top of the funnel. The right action might be to hire another sales rep, increase marketing spend on proven channels, or launch a new feature to drive expansion revenue.
- Is the dip caused by shrinking margins? If growth is strong but profitability has fallen, it's time for an efficiency review. The right action is to scrutinize your major cost centers: headcount, cloud spend (e.g., AWS, Azure), and your software stack. Can you consolidate vendors or renegotiate contracts?
This systematic approach prevents knee-jerk reactions, like slashing the marketing budget when the real issue is bloated R&D spending. For proven frameworks, see our guide to strategic planning for growth.
Stories from the SaaS Trenches
Let's look at how elite operators use this in practice.
A B2B SaaS founder preparing for a Series B round had a solid Rule of 40 score of 42% (30% growth + 12% margin). Knowing that VCs at this stage value growth above all else, they made a strategic decision to reinvest 7% of their margin into accelerating their go-to-market motion. Six months later, their new profile was 45% growth and a 5% margin. The result? A stellar 50% Rule of 40 score that was more attractive to growth investors, helping them secure a higher valuation.
In another scenario, a bootstrapped SaaS company was considering an acquisition offer. Their score was a respectable 38% (18% growth, 20% margin). Instead of selling, the leadership team spent six months on an "efficiency sprint." They optimized support processes and renegotiated their top three vendor contracts. This pushed their margin to 27% while growth settled at 15%. Their new Rule of 40 score of 42% demonstrated a more profitable and resilient business, increasing their final acquisition price by nearly 20%.
An SOP for Your Business Reviews
To make this a repeatable habit, build the Rule of 40 directly into your Monthly and Quarterly Business Review (MBR/QBR) process. Here’s a simple SOP template you can use.
Rule of 40 Review Section for MBR/QBR Deck:
- Slide 1: Rule of 40 Scorecard
- Display the current Rule of 40 score (TTM).
- Show a trend line for the past six quarters.
- Benchmark against your stage-specific target (e.g., "Our Score: 38%, Target: 40%").
- Slide 2: Component Breakdown & Diagnosis
- Chart YoY ARR Growth % and FCF Margin % as separate trend lines.
- Clearly state the primary driver of any change (e.g., "Score declined 3 points due to a 4% dip in growth rate, margin held steady.").
- Slide 3: Action Plan
- Outline 1-2 specific, high-impact actions to address the diagnosis (e.g., "Launch new pricing tier to boost expansion ARR," or "Implement FinOps review process to cut cloud waste.").
- Assign a clear owner, deadline, and expected impact for each action item.
Standardizing this process turns the Rule of 40 from a passive metric into an active management tool.
Your Top Rule of 40 Questions, Answered
Once you start using the Rule of 40, practical questions inevitably arise. Here are direct answers to the most common queries from SaaS operators.
How Often Should I Calculate My Rule of 40 Score?
Calculating this daily or weekly is counterproductive. The inputs—year-over-year growth and TTM profitability—don't change fast enough to provide a meaningful signal.
Follow this operational cadence:
- Monthly for an Internal Pulse Check: Track it in your leadership team meetings to spot emerging trends before they become problems.
- Quarterly for Strategic Decisions: Use it as a core metric in your Quarterly Business Reviews (QBRs) to inform capital allocation decisions for the upcoming quarter.
- Annually for Board & Investor Reporting: This is your headline number for external stakeholders and for benchmarking your performance against the industry.
Consistency is key. Bake it into your standard financial review process so it becomes a familiar part of your operational rhythm.
Is the Rule of 40 the Only Metric That Matters?
Absolutely not. It is a summary metric, not a diagnostic one.
Think of the Rule of 40 as the check engine light on your dashboard. It tells you if there might be a problem, but it doesn't tell you what the problem is. A high score can easily mask serious underlying issues. A company could hit a 50% score (80% growth, -30% margin) but have 30% annual customer churn. This is not a healthy business; it's a leaky bucket being filled by an expensive firehose.
The Rule of 40 tells you if your high-level strategy is working. Metrics like LTV:CAC, CAC Payback Period, and Net Revenue Retention tell you why it is—or isn't.
A healthy SaaS business must have both a strong Rule of 40 score and solid unit economics.
Can a Company with a Low Score Still Be a Good Business?
Yes, but context is critical. A low score isn't an automatic failure, especially for an early-stage company.
A seed-stage startup at $500k ARR might have a 10% score (60% growth, -50% margin) as they invest heavily in finding product-market fit. That's acceptable. For them, the trajectory of the score is what matters. Is the cash burn leading to a growing base of happy, high-retention customers?
A low score is temporarily acceptable when:
- You are in an early, heavy investment phase to capture a market.
- You are making a strategic pivot that requires short-term investment for long-term gain.
- You are weathering a major market downturn affecting your entire industry.
However, for a mature company over $20M ARR, a sustained score below 25% signals deep-seated strategic or operational problems that must be addressed.
What’s the Deal with the Weighted Rule of 40?
The Weighted Rule of 40 is an advanced variation that acknowledges that investors value growth and profitability differently at various stages. It applies a multiplier to give more weight to one side of the equation.
A common formula for a growth-stage company might be:
Weighted Score = (1.5 * Growth Rate) + (0.5 * Profit Margin)
This reflects the reality that for VCs evaluating a high-growth business, growth is often valued more highly than profitability. This variation is most useful when preparing for a fundraising round, as it helps you frame your company's story in a way that aligns with investor priorities.
How Does This Apply to Different Business Models?
While the principle is universal, the interpretation can vary.
- Product-Led Growth (PLG): These companies often have lower margins early on due to heavy R&D and marketing spend to fuel the self-serve funnel. Explosive growth is expected to carry the score.
- Enterprise Sales-Led: These businesses have long sales cycles and high CAC, which can make the Rule of 40 score appear lumpy. The key balancing metric here is very high Net Revenue Retention (NRR) from their enterprise customers.
- Usage-Based Models: Revenue can be volatile. It is essential to use a Trailing Twelve Month (TTM) average for both growth and profitability to smooth out monthly fluctuations and get a true picture of the underlying business health.
No matter your model, the goal remains the same: find the optimal balance between investing for future growth and running an efficient, profitable operation today.
At SaaS Operations, we provide the battle-tested playbooks and SOPs to help you master metrics like the Rule of 40 and build a more efficient, scalable business. Stop guessing and start operating with frameworks proven to accelerate growth. Explore our resources today.