Drowning in feature requests and battling over what to build next? The secret isn't to argue louder; it's to get smarter with a system that favors data over drama. That's exactly why we created this free RICE scoring template—to help you quiet the noise and make product decisions that actually deliver results.
Why RICE Scoring Is a Lifesaver for SaaS Teams
If your roadmap meetings feel more like a cage match than a strategy session, you're not alone. Too many SaaS teams fall into the "loudest voice wins" trap, which leads to a backlog filled with pet projects and half-baked ideas. This is where a simple, structured framework can completely change the game.
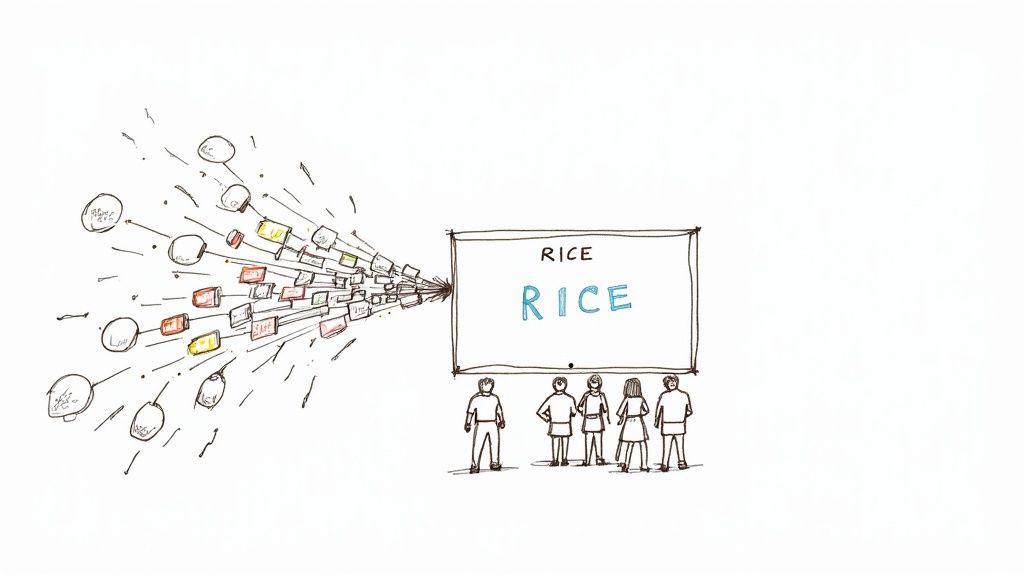
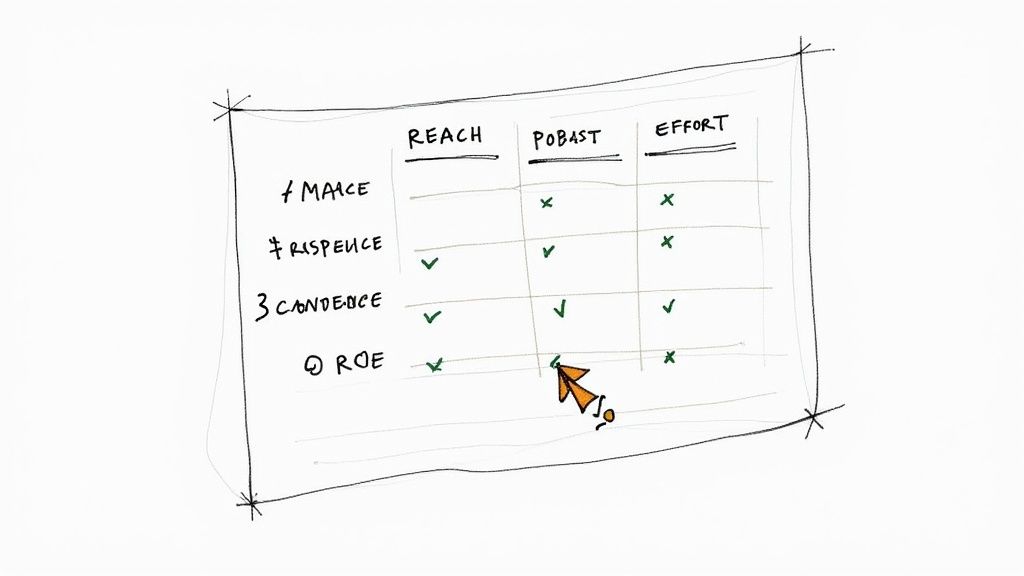
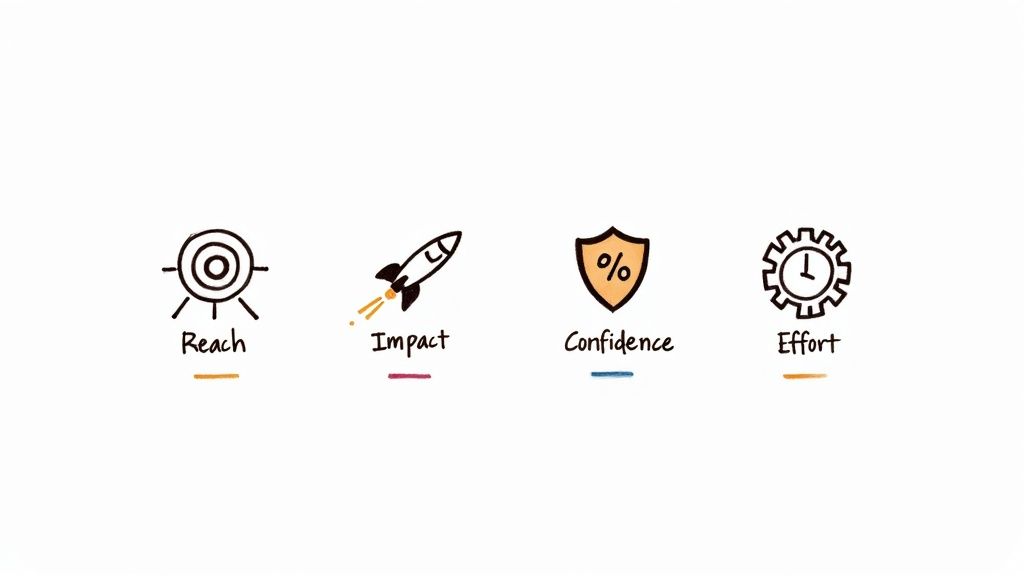
Enter RICE scoring. It's a straightforward but powerful way to take the emotion and bias out of your decision-making. The acronym stands for Reach, Impact, Confidence, and Effort.
This method forces you and your team to ask the right questions before a single line of code gets written:
- Reach: How many of our customers will this feature really touch in a given period?
- Impact: How much will this needle-mover actually move the needle on our core metrics?
- Confidence: Let's be honest—how solid is the data we're using for our Reach and Impact estimates?
- Effort: What's the real cost in terms of our team's time and resources?
By putting a number to each of these, you end up with a single score for every initiative. Suddenly, vague ideas become a clear, prioritized list. Everyone from engineering to marketing can finally see why certain projects are at the top. This is the exact playbook operators at companies like Intercom used to systematize their product decisions and scale effectively.
The real magic of RICE isn't the score itself. It's the conversation it sparks. You stop hearing, "I think we should…" and start hearing, "Here's the data that shows why this matters…"
Get Your Whole Team on the Same Page
When you bring a framework like RICE into your workflow, you start building a culture around evidence, not opinions. The endless debates stop, and everyone starts rallying around the numbers.
Of course, RICE isn't the only tool in the box. For teams looking to get better at prioritization in general, it's worth exploring other methods too. For instance, these Eisenhower Matrix examples to improve prioritization can offer another valuable perspective. At the end of the day, the goal is the same: to build a roadmap based on real strategic value, not just who has the most influence.
Putting Your Free RICE Template to Work
Alright, enough with the theory. The quickest way to wrap your head around RICE is to just dive in and start scoring. To make that easy, we've created a straightforward free RICE scoring template specifically for SaaS teams. There are no sign-ups or email gates here—just a Google Sheet that's been battle-tested in real-world backlogs.
First, you'll want to make a copy for yourself. You can access the template directly from our SaaS Operations toolkit. Once it’s open, just click File > Make a copy to get it into your own Google Drive. That gives you your own private version to start populating with your projects.
A Quick Tour of the Template
Once you've got your copy, you’ll notice it’s designed to be clean and simple. This isn’t just a fancy calculator; it's a tool for getting your whole team on the same page. Each row is a blank slate for a feature, project, or idea you're kicking around.
Here's what each column is for:
- Feature/Initiative: Just a simple, clear name for the project. No jargon needed.
- Reach: This is where you'll estimate how many people will be affected in a specific timeframe (e.g., users per month or customers per quarter).
- Impact: We use a 0.25 to 3 scale here. It’s a gut check on how much this feature will actually help each user who finds it.
- Confidence: Your best guess, as a percentage (50%, 80%, 100%), of how solid your Reach and Impact numbers are. Be honest!
- Effort: This is the total time and resources your team will need, usually measured in "person-months."
- RICE Score: The magic happens here. This column automatically calculates the score for you, so you don't have to touch it.
The sheet handles all the math, running the (Reach * Impact * Confidence) / Effort formula for you and spitting out a number. Remember, this score isn't the final word—it's the starting point for a much smarter conversation. It instantly gives you a ranked list, making it obvious which ideas pack the biggest punch for the least amount of work.
This simple layout is a game-changer. It takes a chaotic backlog and turns it into an ordered, defensible roadmap. It’s the kind of clarity that stops endless debates and gets everyone focused on what's going to move the needle.
This template is built to slide right into your existing workflow. A lot of SaaS leaders I know feed these scores directly into their reporting dashboards. If you want some ideas on how to show this data to stakeholders, checking out a good scorecard format in Excel can give you some great inspiration for making your priorities clear and actionable.
Getting to Grips with Each Part of RICE
A prioritization score is only as solid as the numbers you plug into it. To really make our free RICE scoring template work for you, you've got to move past pure guesswork and ground each component in reality. Let's walk through the playbook for scoring each element, using real-world SaaS situations.
Reach: How Many People Will This Actually Touch?
Reach is all about a simple question: How many users will this feature or project affect over a set timeframe? The trick is to get specific. What do you mean by "users," and what's the "timeframe"?
For a revamped onboarding flow, your "users" are likely new signups per month. If you're building a new reporting feature, it's probably active accounts per quarter.
Don't pull these numbers out of thin air. Dive into your analytics tools—Mixpanel or Amplitude are great for this—or run a query directly against your own database. If you're building something for your enterprise-tier customers, your reach isn't your total user base. It's the number of users on that specific plan, which is a much smaller, more targeted group. Getting this right is crucial.
This data-first approach is becoming the norm. A Zeda.io study found that 78% of product managers using free RICE templates felt their decisions were more accurate and less biased. Why? Because the framework forced them to put a real number on concepts like Reach. You can check out more of their insights on the Zeda.io blog.
Impact: What's the Real-World Effect?
Impact tries to measure just how much a new feature will help users get their jobs done. This is easily the most subjective part of RICE, which is why having a standardized scale is a non-negotiable. Forget vague terms like "high" or "low." Instead, tie your scores directly to tangible business goals.
Here's a simple scale that many SaaS teams I've worked with have found useful:
- 3 (Massive): Directly moves a core business needle, like user activation, conversion, or retention. Think of a feature that solves the main problem your product was built to address.
- 2 (High): Creates a strong, measurable lift in user engagement or satisfaction. A workflow automation that saves users a ton of time is a perfect example.
- 1 (Medium): A noticeable quality-of-life improvement. This could be a redesigned UI element that makes the app feel smoother.
- 0.5 (Low): A minor tweak or a small "nice-to-have." Adding a new color theme would fall into this category.
When you tie scores to specific outcomes, you build a shared language across your team. It makes the whole process far more consistent and helps everyone understand which metrics matter. If you need a refresher, it’s always a good idea to explore the different SaaS KPIs you should be tracking.
To make this even clearer, I've put together a quick reference table.
RICE Component Scoring Guide for SaaS
This little guide provides some concrete examples for scoring each RICE component, specifically for SaaS product teams. Think of it as a cheat sheet to keep your scoring consistent.
| Component | What It Measures | Scoring Scale Example | Data Source Example |
|---|---|---|---|
| Reach | Number of unique users/accounts that will encounter the change. | Direct number of users/accounts per month/quarter. Example: 1,500 active users on the Pro plan will see this feature. | Product analytics (Mixpanel), CRM data (Salesforce) |
| Impact | How much the change will positively affect the user's objective. | 3 (Massive), 2 (High), 1 (Medium), 0.5 (Low), 0.25 (Minimal). Example: This automation scores a 2 because it reduces a key task's time by 50%. | User feedback (Surveys), A/B test results, support tickets |
| Confidence | How much evidence you have to back up your Reach & Impact scores. | 100% (High), 80% (Medium), 50% (Low). Example: 80% confidence based on strong user interview feedback, but no hard data yet. | User research, prototype testing, market data |
| Effort | The total time investment required from all teams involved. | Person-months. Example: 1 designer for 2 weeks + 2 engineers for 4 weeks = 2.5 person-months. | Engineering lead estimates, team capacity planning tools |
Keep this handy, and you'll find your RICE discussions become much more productive and data-informed.
Confidence: Your Gut-Check Backed by Data
Confidence is where you temper your enthusiasm with a dose of reality. It asks a critical question: How sure are we about our Reach and Impact numbers? This score is your built-in mechanism to stop you from chasing shiny objects that are built on shaky assumptions.
Assign a percentage based on the evidence you actually have:
- 100% (High Confidence): You have hard quantitative data from user behavior and you've validated it with qualitative feedback from user interviews. You're rock solid.
- 80% (Medium Confidence): You've got great qualitative insights, or maybe data from a similar feature launch in the past. You're making a logical leap, but it's a well-supported one.
- 50% (Low Confidence): This is more of an "inspired idea" than a data-backed plan. It’s a hunch, even if it's a well-informed one.
If your confidence score dips below 50%, the idea probably isn't ready for prioritization. It's a signal that you need to do more research first. Think of Confidence as a filter that pushes unsubstantiated ideas further down the list where they belong.
Effort: A Collaborative Estimate, Not a Wild Guess
Finally, there's Effort. This isn't just about engineering time; it's the total time required from everyone—product, design, and engineering—to get this thing live. The key here is to get a realistic estimate without completely derailing your team.
Don't just ping your tech lead with a vague "how long will this take?" Instead, bring them a handful of your top-priority, well-defined ideas. Show up with clear user stories, maybe even some rough mockups.
Ask for a ballpark estimate in "person-months." For example, "This looks like it would take two engineers about a month, so we'll call that 2 person-months." This collaborative approach respects your engineering team's time and gets you a much more accurate number for the "E" in your RICE calculation.
Putting RICE to the Test: A Real-World SaaS Showdown
Alright, let's move past the theory. The RICE framework really comes to life when you see it solve a real-world problem. I’m going to walk you through a classic SaaS product dilemma to show how our free RICE scoring template can bring instant clarity to a tough decision.
Picture this: you're a product manager at a growing B2B SaaS company. You've got enough team capacity for one big project next quarter, and two very different ideas are competing for that top spot.
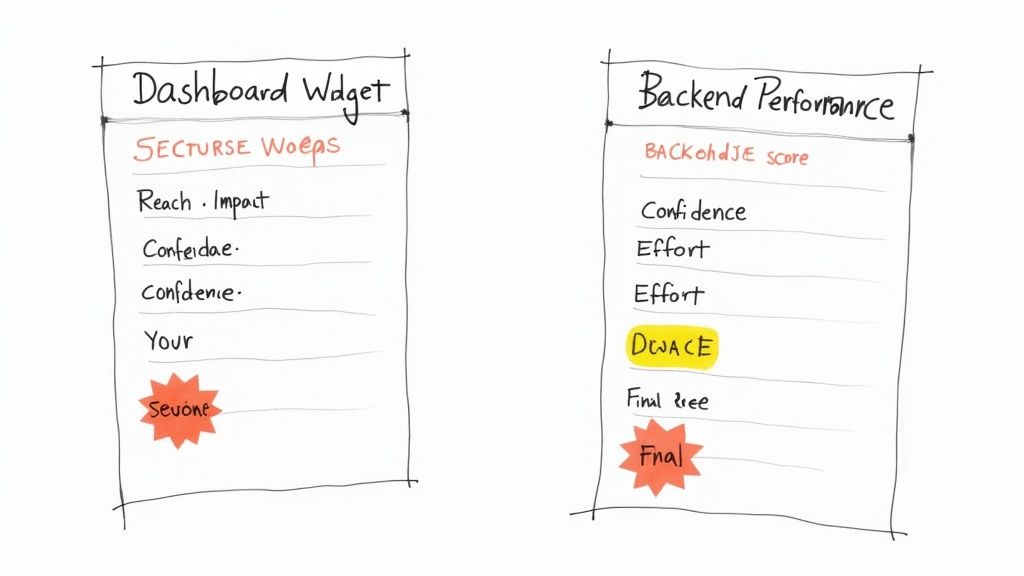
- Initiative A: The New Dashboard Widget. This is a flashy, high-profile feature. It’s been specifically requested by three of your largest enterprise clients—the kind of customers who aren't shy about making their needs known. They see it as a must-have.
- Initiative B: The Backend Performance Tune-Up. This one is a pure "under-the-hood" project. It involves refactoring some legacy code to speed up a core workflow for every single user. It’s not exciting, no one is emailing you about it, but the dev team insists it’s a growing bottleneck.
Which do you choose? Without a framework, it's incredibly tempting to go with the widget. Pleasing those big accounts feels like the obvious political win. But let’s plug them into the RICE model and see what the data tells us.
Sizing Up the Dashboard Widget (Initiative A)
First, we’ll run the numbers for the shiny new widget.
- Reach: Our three enterprise clients have a combined 200 users who would actively use this new dashboard component. So, Reach = 200.
- Impact: For those 200 people, the widget is a game-changer. It solves a massive reporting headache they deal with daily. The value is undeniable. We'll give it a massive impact score of 3.
- Confidence: The request came directly from the customers who need it, and they’ve already given thumbs-up on the mockups. We're very confident we're building the right thing. Let's score it at 100%.
- Effort: This is a heavy lift. It requires new data pipelines and a complex front-end build. The team’s estimate is one designer and two engineers for a full month, putting the effort at 3 person-months.
The template crunches the numbers: (200 * 3 * 1.0) / 3 = 200.
This is a classic trap. A feature feels urgent and critical because of who’s asking for it. The RICE score forces an objective look beyond the noise and focuses on the actual, quantifiable value.
Evaluating the Backend Tune-Up (Initiative B)
Now for the less glamorous—but potentially more impactful—performance project.
- Reach: This fix improves a workflow that every single active user touches. Looking at our product analytics, that’s 2,500 users every month. Our Reach is 2,500.
- Impact: The speed boost will be noticeable and will definitely make the product feel better, but it's not going to unlock a totally new capability. It’s a solid quality-of-life win, so we’ll assign it a medium impact score of 1.
- Confidence: The engineering team has already done a technical spike and mapped out the work. They are certain about the fix and the expected outcome. Confidence is high, so we’ll call it 100%.
- Effort: Because of that preliminary investigation, the team knows exactly what to do. They estimate it'll only take one engineer two weeks to knock it out. That's just 0.5 person-months.
Let's see the score: (2,500 * 1 * 1.0) / 0.5 = 5,000.
And the Winner Is…
The results couldn't be clearer. The Backend Tune-Up scores a massive 5,000, completely overshadowing the Dashboard Widget's 200.
This is the magic of the RICE framework. It quiets the "squeaky wheel" and shines a spotlight on high-leverage projects that benefit your entire customer base, not just the loudest ones. With a clear winner chosen, the next step is planning a smooth rollout. To make sure nothing gets missed, a solid plan is essential, and our comprehensive product launch checklist is the perfect tool to keep your team on track.
Making RICE Part of Your Team's DNA
A great template is one thing, but making it a core part of how your team operates is another game entirely. The real goal is to turn that spreadsheet from a static document into a living, breathing tool that guides your day-to-day decisions and shapes your long-term plans.
When you roll this out, the key is getting genuine buy-in, not just forced compliance. Position the RICE framework as a tool for clarity, not a new layer of bureaucracy. For your engineers, it finally answers the "why" behind their work. For your customer success team, it’s proof that their feedback isn't going into a black hole—it's being measured and considered.
And this isn't just a niche practice. According to a 2023 survey, a whopping 85% of product managers have used a free RICE scoring template at some point. Even better, the data showed that teams who adopted them were 30% more likely to get their prioritization done on time. You can dive deeper into these product manager RICE prioritization findings on ProductTeacher.com.
Nail Down a Simple Submission and Scoring Process
If you want RICE to stick, you have to make it dead simple to submit and score new ideas. Forget complex workflows. All you need is a clear, low-effort process.
- One Front Door for Ideas: Set up a single, official spot for all new ideas. This could be a dedicated Slack channel (
#new-ideas), a simple Airtable form, or even a specific list in your project management tool. Just pick one and stick to it. - Pick a Point Person: Assign one person—usually the Product Manager—to be the "Directly Responsible Individual" (DRI). Their job is to grab new submissions, add them to the free RICE scoring template, and take a first stab at the scores.
- Run a Weekly Triage Meeting: Block off 30 minutes every week. Invite the key players (like the product lead, tech lead, and a customer success manager) to quickly review the newly scored items. This is where you debate the numbers, challenge assumptions, and tweak the scores together. It keeps everything transparent and collaborative.
The magic really happens with consistency. When the whole team sees that every single idea, whether it came from the CEO or a bug report, goes through the exact same objective scoring process, they start to trust the system and the decisions that come out of it.
From a Score to a Solid Roadmap
That prioritized list you've built? It should be the starting point for all your planning meetings.
When you kick off a new quarter, your first move should be to pull up the template and look at the top-scoring items. This is also the perfect time to establish a "priority threshold." For example, you might agree as a team that any feature with a RICE score over 1,500 is automatically considered for the upcoming roadmap.
A simple rule like that cuts through so much noise. Your roadmap meetings are suddenly way more productive. You're no longer debating a laundry list of random ideas from scratch. Instead, you're focused on strategically sequencing a handful of pre-qualified, high-impact projects. This kind of operational discipline is crucial for scaling, especially when you start implementing workflow automation for your SaaS.
Frequently Asked Questions About RICE Scoring
After walking dozens of SaaS teams through this framework, I've seen the same questions pop up every single time. Using a RICE scoring template is a game-changer for your workflow, but it definitely sparks some new conversations. Here's how I usually answer the most common ones.
How Do We Settle Disagreements on Scores?
First off, disagreements are a good thing! It means your team is actually thinking critically about the work. The trick is to stop arguing about opinions and start pointing to a predefined scoring guide.
For example, maybe you all agree that an "Impact" score of 3 means a feature will improve a core KPI, like user retention, by at least 5%. When a debate starts, you just pull up the guide and the data. "Does our research support a 5% bump?"
Your best friend in these debates is the "Confidence" score. If the team is split and the data is shaky, that’s a low confidence score, plain and simple. That naturally drops the feature's priority until someone can bring more evidence to the table. The goal isn't to get everyone to agree perfectly; it's to make a transparent, well-reasoned decision.
Should We Ever Work on Something with a Low RICE Score?
Of course. RICE is a guide, not a dictator. There are always strategic reasons to override the numbers.
Sometimes, you just have to do the work. You might need to build something to close a huge enterprise deal, fix a piece of tech debt that’s dragging the whole engineering team down, or maybe just add a "table stakes" feature to keep up with the competition.
The key is to be deliberate about it. When you decide to ignore a low score, call it out. Document why you're doing it. This keeps your process honest while still giving you the agility to make smart business calls.
How Often Should We Re-Score Our Backlog?
Your priorities aren't set in stone, so your scores shouldn't be either. I always recommend teams re-score their most important backlog items at least once a quarter.
Think about it: a new marketing campaign could blow up a feature's potential "Reach." A round of customer interviews might make your "Confidence" in an idea skyrocket. A new API could cut the "Effort" in half.
A quarterly check-in keeps your roadmap aligned with what’s actually happening in your business and the market. For those less critical items way down the list, you can just wait to re-score them as they get closer to the top of the pile. And if you're looking for more general tips, you can find additional insights on prioritization from the Taskignite blog.
Ready to stop guessing and start shipping features that actually move the needle? Our team at SaaS Operations has a battle-tested template that's ready to go. Grab your free RICE scoring template and bring some much-needed clarity to your product roadmap.