Free Net Revenue Retention Calculator for SaaS Growth
Tired of wrestling with complicated spreadsheets just to figure out your Net Revenue Retention? We get it. That's why we built this free net revenue retention calculator. It’s designed to give you a clear, instant snapshot of your SaaS company's health by focusing on your most important asset: your existing customers.
Your Free NRR Calculator for Instant Insights
Let's cut through the noise of vanity metrics. If you want to understand your company's real growth potential, Net Revenue Retention (NRR) is the metric that matters most. It gets to the heart of a simple but crucial question: are you making more money from your existing customers than you're losing from them?
What makes NRR so powerful is that it ignores new customer acquisition to focus solely on the health of your current relationships. Think of it this way: a high NRR shows that your product has its own built-in growth engine, one that's fueled by the very people who already know and trust you. It's no wonder investors and smart SaaS operators are obsessed with it.
Understanding the Inputs
Before you jump in and start punching in numbers, let's quickly walk through the key pieces of the puzzle. Each of these inputs tells a specific part of your revenue story over a set period, usually a month or a quarter.
To make it even clearer, here’s a quick breakdown of what you'll need to plug into the calculator and what the results will tell you.
NRR Calculator Inputs and Outputs at a Glance
Understand the key components you'll need for the calculator and what the final NRR percentage reveals about your business health and product stickiness.
| Metric | What It Measures | Why It's a Critical Input |
|---|---|---|
| Starting MRR | Your Monthly Recurring Revenue from a specific group of customers at the start of the period. | This is your baseline. It establishes the cohort of customers whose revenue journey you're tracking. |
| Expansion MRR | New revenue from that same group through upgrades, cross-sells, or new feature add-ons. | This is your growth engine. It shows how well you're delivering more value to happy customers. |
| Contraction MRR | Revenue lost when existing customers downgrade to a cheaper plan or reduce their usage. | This signals a potential value gap or changing customer needs that you need to address. |
| Churned MRR | The total revenue lost from customers in the cohort who cancelled their subscriptions entirely. | This is your biggest leak. It measures the revenue you've completely lost and need to offset. |
These inputs are the building blocks of your NRR. Once you have them, the calculation itself is straightforward, revealing whether your expansion efforts are winning the tug-of-war against churn and downgrades.
By the way, offering a free tool like this is a perfect example of engineering as marketing—where you provide something genuinely useful to attract and help your ideal audience.
For any SaaS leader, NRR is more than just a number; it's the ultimate report card on your product-market fit and the value you deliver. An NRR over 100% means your business is growing even if you don't sign a single new customer.
For SaaS operators trying to build a business that lasts, getting a handle on this calculation is step one. If you're looking for more tools to help you grow, check out our full suite of free resources over at https://saasoperations.com/tools/.
What Net Revenue Retention Really Means for Your Business
Forget the textbook definitions for a second. Let's think about your business like a bucket you're trying to fill with water, where water is your revenue. New customers are the stream of fresh water you're constantly pouring in. But every business has leaks—that's customer churn, draining precious revenue out.
So, what does Net Revenue Retention (NRR) tell you? It answers one simple, but absolutely critical, question: even if you turned off the hose of new customers, is the water level in your bucket still rising on its own, just from the customers you already have?
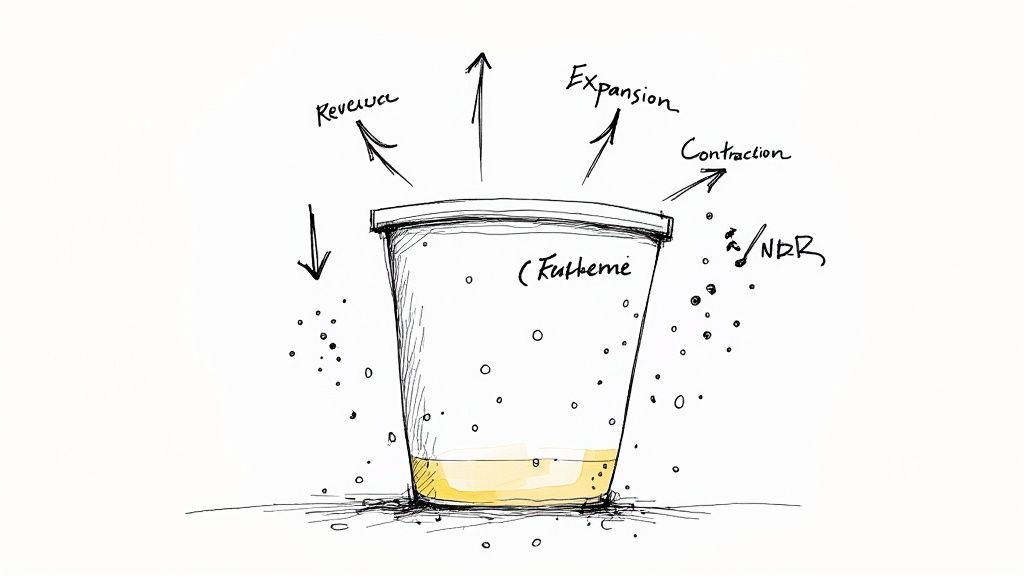
This bucket analogy really hits home because it isolates the health of your existing customer base. It gives you a clean, unfiltered look at how sticky your product is and how happy your customers are. When your NRR tips over 100%, you've found the holy grail: a powerful, built-in growth engine that works for you.
The Four Pillars of NRR
To get a real feel for NRR, you need to know the four key ingredients that go into it. Each one tells a crucial part of the story about how your existing customer revenue shifts over time.
- Starting MRR: This is your starting line. It's the total Monthly Recurring Revenue you had from a specific group of customers at the beginning of a period.
- Expansion MRR: This is the hero of the story. It’s all the new revenue you generate from that same group when they upgrade, buy more products, or add more users.
- Contraction MRR: This is the flip side—the revenue you lose when customers downgrade to a cheaper plan or use your service less. It’s a warning sign that you might have a value gap.
- Churned MRR: This is the big one. It's the total revenue lost when customers from that starting group cancel their subscriptions and leave for good.
Going back to our bucket, Expansion MRR is like making the water you already have magically expand, while also patching some of the smaller leaks. Contraction and Churn are the holes you're constantly trying to plug. The final NRR percentage tells you who's winning that fight. You can see how these numbers play out using a free net revenue retention calculator, and for a deeper dive, check out our complete guide on the nuances of the net retention rate.
Using simple calculators for this has exploded since 2020, as more companies want to track this stuff without shelling out for an expensive analytics platform. In fact, a 2022 report showed that over 65% of mid-sized SaaS companies in North America and Europe use free online NRR tools in their monthly financial check-ins.
A high NRR doesn't just happen by accident. It's the direct result of a relentless focus on customer success. To investors, it’s the clearest signal that you've hit true product-market fit and are building a business for sustainable, profitable growth.
Alright, let's get down to brass tacks. Theory is great, but what you really need to know is how to make this work for your business.
Let's walk through the free net revenue retention calculator with a real-world example. We'll follow a fictional B2B SaaS company I've invented called 'SyncUp' and see how their April numbers shake out.
This is where the rubber meets the road. I'll show you exactly where to plug in your own data to get a clear NRR score in just a few minutes.
Step 1: Grab Your Key Numbers
First things first, SyncUp needs to pull four essential metrics for the month. This data is the bedrock of the whole calculation. The most important thing to remember here is that we're only looking at the group of customers who were with you on day one of the period. No new customers allowed in this cohort.
For our April example, here are SyncUp's numbers:
- Starting MRR (April 1): $50,000 from their existing customer base.
- Expansion MRR: $5,000 from three customers who wisely upgraded to a higher tier.
- Contraction MRR: $1,000 lost when one big client downgraded their plan. Bummer, but it happens.
- Churned MRR: $2,500 gone for good from two customers who cancelled their subscriptions.
Step 2: Plug 'Em into the Calculator
Got your data? Perfect. Now, you just pop each number into its designated spot in the calculator.
Think of it this way: the Starting MRR is your baseline. Everything else—the good, the bad, and the ugly—shows how revenue shifted within that starting group of customers over the month.
Here’s a peek at what it looks like when SyncUp enters its data into our NRR calculator.
Seeing it visually like this really helps you understand how the positive and negative revenue changes balance out.
Step 3: Check Out Your NRR Score
The second you fill in the last field, the calculator does the heavy lifting and spits out your Net Revenue Retention rate.
For SyncUp, the math looks like this:
($50,000 Starting MRR + $5,000 Expansion – $1,000 Contraction – $2,500 Churn) / $50,000 Starting MRR
This gives SyncUp a final NRR of 103%.
Now that is a fantastic result. Any NRR score over 100% is a huge win. It means that even after losing $3,500 from downgrades and cancellations, the revenue from their existing customers still grew by a net 3%. SyncUp's expansion efforts completely covered its losses and then some, which is a powerful sign of a healthy, sustainable business.
Of course, getting a handle on revenue churn is a massive part of this whole picture. If you want to zoom in on that specific metric, you can use our free churn rate calculator to dig a little deeper.
What’s a Good NRR? How to Benchmark Your Score
Okay, so you've plugged your numbers into a free net revenue retention calculator and have a percentage staring back at you. Now what? A number on its own is just noise. The real magic happens when you put that score into context and see how you stack up against other SaaS businesses.
For pretty much any SaaS company, an NRR over 100% is a great sign. It means your expansion revenue from existing customers is outpacing any losses from churn or downgrades. Think of it this way: your current customer base isn't just sticking around; it's actively growing your business for you. That's a powerful growth engine.
This infographic really nails down the moving parts—your Starting MRR, the boost from Expansion, and the drag from Churn—that all come together to give you that final NRR score.
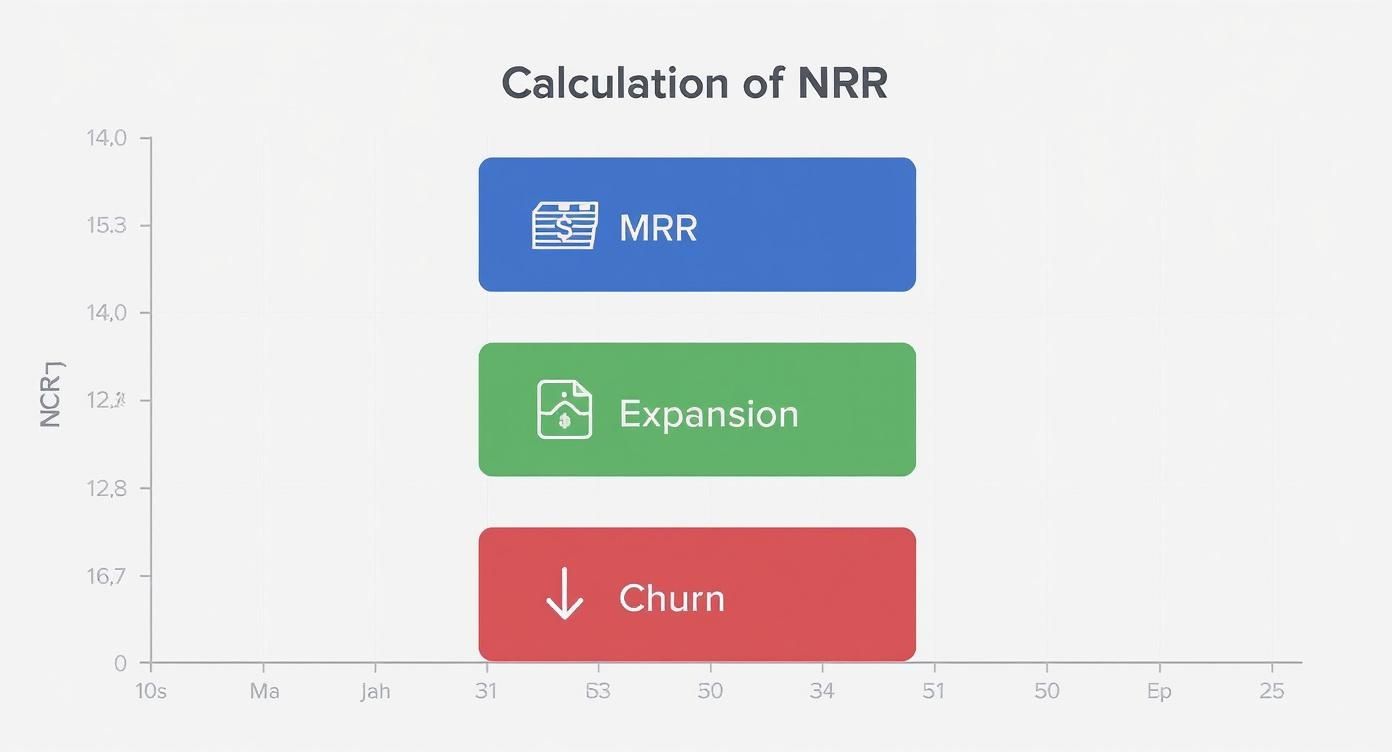
You can see it’s a constant tug-of-war. On one side, you have customers upgrading and buying more, and on the other, you have customers leaving or scaling back. Your starting revenue is the baseline for it all.
SaaS NRR Benchmarks by Company Growth Stage
So, we know 100% is the magic number, but "good" isn't a one-size-fits-all target. A stellar NRR for a scrappy startup might just be table stakes for a massive enterprise. Your Annual Recurring Revenue (ARR) plays a huge role in what you should be aiming for.
The table below breaks down NRR benchmarks by company stage. See where you land—are you keeping pace, or is there room to grow?
| Company Stage (ARR) | Median NRR | Top Quartile NRR |
|---|---|---|
| < $1M | 95% | 105% |
| $1M – $10M | 100% | 115% |
| $10M – $50M | 105% | 120% |
| > $50M | 110% | 125%+ |
Public darlings like Snowflake and Twilio consistently post NRR rates well over 120%, which is a big reason they get so much love from investors. They are masters at growing with their customers.
As you can see, expectations climb as you scale. Understanding these nuances is key, and you can dive deeper into a whole range of SaaS metrics benchmarks to get a fuller picture of how performance metrics change as a company grows.
Here’s a little nugget for you: a global survey from ChartMogul in 2023 found that the average NRR for SaaS businesses who used free calculators to track performance was 108%. For those who didn't? Just 95%. It goes to show that what gets measured really does get managed.
An Actionable Playbook for Improving Your NRR
Okay, so you know your Net Revenue Retention score. That's step one. But the real magic happens when you start to improve it. That’s how you build a SaaS business that’s not just growing, but resilient.
This isn't about theory. What follows is a playbook packed with battle-tested strategies from operators who have actually turned their NRR into a growth engine. These are the next steps you can take to make a real impact.
When you boil it all down, boosting NRR comes down to two things: plugging the leaks in your revenue bucket (that’s churn and contraction) and widening the faucet (that’s expansion).
Let’s get into how to master both.
Part 1: Fortifying Your Defense Against Churn and Contraction
Before you can even think about expansion, you have to protect the revenue you already have. The biggest lever you can pull here is to implement smart strategies to reduce customer churn. This is all about getting proactive, not waiting for the cancellation email to land.
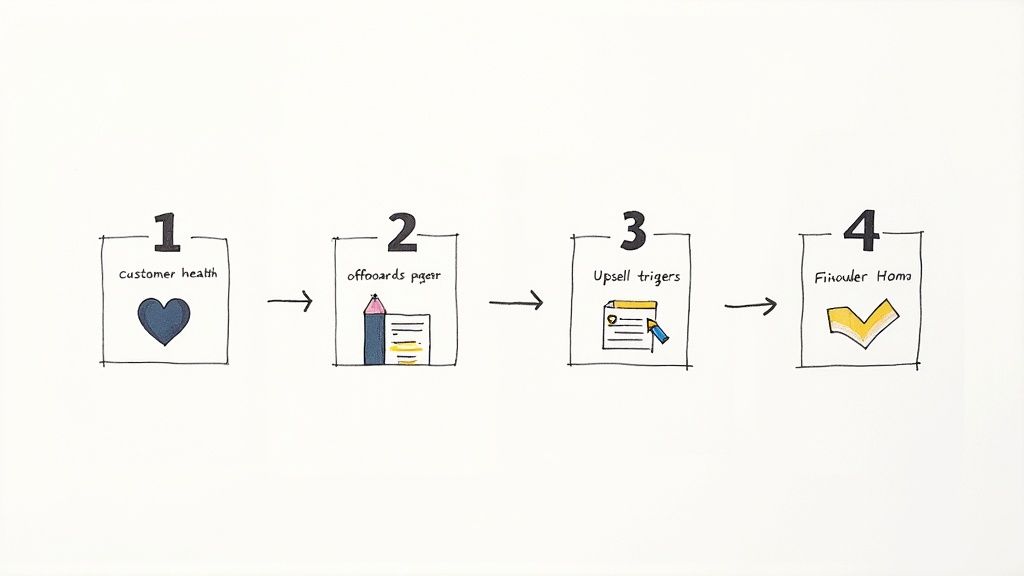
A fantastic place to start is by building a customer health score. This isn’t just about counting support tickets; it’s about blending different data points to get a predictive read on which customers are happy and which are quietly heading for the exit.
Key Inputs for a Customer Health Score:
- Product Usage: Are they actually logging in? Using the sticky features? Or has their activity dropped off a cliff?
- Support Interactions: How many tickets are they filing? More importantly, what’s the tone of those conversations? Are their problems getting solved fast?
- NPS & CSAT Scores: What are they telling you directly? Are they cheering you on or quietly fuming?
- Billing History: Any recent failed payments? Have they been sniffing around the downgrade page?
By assigning a weighted score to these signals, you give your customer success team a "watch list" of at-risk accounts before they churn. This lets you reach out, solve a problem, and turn a potential loss into a loyal customer.
Another critical piece is designing a solid offboarding process. When a customer does decide to leave, don't just wave goodbye. Use a simple churn survey to ask one simple question: “What’s the main reason you’re canceling?”
"We started using NPS, which was a really great feature because it gave us feedback almost instantly. This helped us get in touch with customers more quickly and understand their concerns with the product, which, in turn, helped us reduce our churn rate."
— Subhash Yadav, Product Marketer at Unolo
This feedback is pure gold. It gives you a direct look at product gaps, pricing problems, or a new competitor you need to worry about. Think of it as a crucial feedback loop for the long-term health of your business.
Part 2: Fueling Growth with Strategic Expansion
With your defenses shored up, it’s time to focus on the fun part of NRR: expansion revenue. This is what separates the good companies from the great ones. And it all starts with spotting the triggers that signal an upsell opportunity.
Map out your customer journey and pinpoint those "aha!" moments. What actions indicate a customer is getting a ton of value and is probably ready for more? For a project management tool, maybe it's when a team creates its 10th project or invites its 20th user.
Once you know those triggers, you can build automated, in-app prompts to nudge them along. Slack is the undisputed master of this. The moment you try to view message history beyond your plan's limit, a perfectly timed message pops up offering an upgrade. The need is immediate, and the solution is right there.
This slick approach really only works if you have two things in place:
- Value-Based Pricing Tiers: Your pricing can't be random. Each tier needs to unlock a clear set of features or usage limits that deliver progressively more value as a customer’s needs grow.
- Frictionless Upgrade Paths: Make it ridiculously easy to upgrade. A one-click, in-app process will always beat forcing someone to call sales.
The impact of actively managing these metrics cannot be overstated. A 2021 study found that SaaS companies that consistently tracked NRR saw their annual revenue grow by an average of 22%, compared to just 15% for those who didn't. That's a huge difference.
By combining a strong defense against churn with a smart offense for expansion, you create a powerful, self-sustaining growth loop. For a deeper dive into how to structure all of this, check out our comprehensive customer success playbook, which has plug-and-play templates to help you build these systems from the ground up.
NRR FAQs: Your Questions Answered
Even with a clear formula, a few questions about Net Revenue Retention tend to pop up all the time. I've heard these from countless SaaS operators, so let's tackle them head-on with some quick, straightforward answers.
What Is the Difference Between NRR and GRR?
Think of it this way: Gross Revenue Retention (GRR) just looks at your ability to hang onto the revenue you already have. It completely ignores any upsells or expansion. Its ceiling is 100%, and it basically tells you how much your revenue bucket is leaking from customers leaving or downgrading.
Net Revenue Retention (NRR), on the other hand, tells the whole story. It factors in all that juicy expansion revenue from upsells and cross-sells. This is why NRR can soar above 100%. GRR is about stickiness; NRR is about growth from the customers you've already won.
How Often Should a SaaS Business Calculate NRR?
For most SaaS businesses, calculating NRR on a monthly basis is the way to go. This rhythm lets you catch trends early and see if your retention efforts are actually working. You can react before a small dip turns into a major problem.
Bigger, enterprise-focused companies might get away with quarterly NRR for board meetings, but for day-to-day operations, monthly tracking is essential. It gives you the real-time pulse of your business. Consistency here is everything.
The whole point of NRR is to isolate the performance of your existing customer base. It gives you a pure, unfiltered look at how happy your customers are and whether your product is delivering more value over time.
Can My NRR Include Revenue from New Customers?
Nope. Absolutely not. And that’s precisely what makes NRR so powerful. It only looks at revenue changes from the group of customers you had at the start of the period.
NRR intentionally separates the health of your existing relationships from your new customer acquisition engine. This laser focus is why using a free net revenue retention calculator is so effective—it helps you diagnose the health of your customer base without any noise from sales and marketing.
Is It Possible to Have a Negative NRR?
Yes, it's possible, but if you see it, all alarm bells should be ringing. A negative NRR means you lost more revenue from churn and downgrades than you even started with from that customer group.
Frankly, it's a sign of a business in critical condition. It points to an exceptionally high churn rate and probably severe problems with your product-market fit or the value you're delivering. For a healthy SaaS company, anything below 90% is a worry, but a negative NRR requires immediate, five-alarm-fire-level attention.
At SaaS Operations, we provide proven, battle-tested playbooks and templates to help you build a more efficient and effective business. Stop guessing and start implementing frameworks that accelerate growth. Learn more at https://saasoperations.com.