10 Actionable Sales Forecasting Techniques for SaaS Operators in 2025
Nailing your sales forecast is the difference between scaling predictably and flying blind. For SaaS operators, an accurate forecast isn't just a number to hit; it’s your roadmap for hiring plans, marketing spend, and critical product investments. It’s the core of a data-driven operating system, dictating resource allocation and shaping your growth trajectory. But with dozens of methods out there, which one actually works for a recurring revenue model?
Forget the abstract theories and generic advice. We’re diving into ten battle-tested sales forecasting techniques used by top SaaS leaders to achieve predictable revenue. This isn't a high-level overview. It's a practical, actionable playbook designed specifically for operators.
Inside, you'll find a breakdown of each method, complete with:
- Step-by-step implementation notes.
- The exact KPIs and data inputs you'll need.
- Common pitfalls and how to sidestep them.
- Automation and tooling suggestions to streamline the process.
To move beyond guessing and embrace predictable revenue, exploring the most powerful real-time analytics use cases can directly inform and enhance your sales forecasting efforts. By the end of this article, you won't just understand different forecasting models; you'll have a clear framework to choose and implement the right techniques for your business. Let's get started.
1. Time Series Analysis
Time series analysis is one of the more statistically-driven sales forecasting techniques, perfect for SaaS businesses with at least two years of historical sales data. At its core, this method involves looking at your past sales data (think monthly recurring revenue, new sign-ups, or churn rates) collected at regular intervals to spot trends, seasonal patterns, and cycles. By breaking down your history, you can project those patterns forward to predict what's coming next.
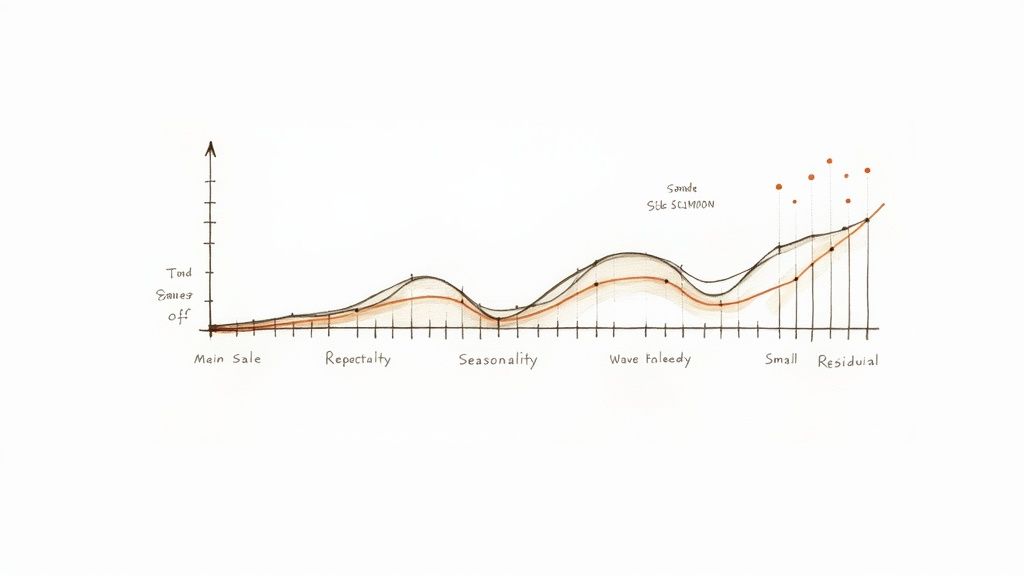
This technique moves beyond simple "last month plus 5%" guesses. It uses models like ARIMA (AutoRegressive Integrated Moving Average) or Holt-Winters to systematically decompose your data into its core components. This gives you a much clearer picture of the underlying forces driving your sales.
Why It Works for SaaS
SaaS companies often experience seasonality you might not expect. For example, a B2B SaaS might see a dip in new trials during major holiday seasons or a surge in Q4 as companies spend their remaining budgets. An EdTech SaaS will almost certainly see huge spikes around the start of school semesters. Time series analysis is brilliant at identifying and quantifying these predictable rhythms in your business.
Actionable Insight: Look at Calendly's growth. They experience predictable spikes in usage and sign-ups around January (new year resolutions) and September (back to school/work). A time-series model would capture this seasonality, allowing them to staff up customer support and scale server capacity ahead of the surge, turning a potential cost center into a smooth onboarding experience.
How to Implement It
- Gather Your Data: Export at least 24 months of historical sales data (e.g., monthly new MRR, user sign-ups) from your CRM or billing platform like Stripe or Chargebee. Ensure the data points are at consistent intervals (daily, weekly, monthly).
- Clean and Visualize: Plot your data on a chart. Look for obvious trends (is it generally going up?), seasonality (are there repeating peaks and valleys?), and outliers. Remove one-off anomalies that won't repeat, like a single massive enterprise deal that skews a month's data.
- Choose a Model:
- Moving Averages: A simple start. Average the last 3 or 6 months of data to smooth out noise and see the underlying trend.
- Exponential Smoothing (Holt-Winters): Better for data with clear trends and seasonality. This model gives more weight to recent data.
- Decompose and Forecast: Use a tool (even a spreadsheet with the right functions, or more advanced tools like Prophet or R) to break your data down into its trend, seasonal, and random components. The model will then extrapolate these patterns into the future.
- Validate and Refine: Always check your forecast against actual data as it comes in. If your forecast is consistently off by more than 10-15%, it's time to tweak the model's parameters or incorporate new variables.
2. Exponential Smoothing
Exponential smoothing is a sophisticated sales forecasting technique that builds on the idea of moving averages but with a crucial twist. It assigns exponentially decreasing weights to older observations, meaning recent sales data gets more importance in the forecast. This method assumes that recent events are better predictors of the future, making it highly responsive to recent changes in sales momentum.
This approach is more than just a simple average; it’s a weighted system designed to reflect current market dynamics more accurately. Models like Simple Exponential Smoothing handle data without a trend, while more advanced versions like the Holt-Winters method can systematically account for both trend and seasonality in your sales data.
Why It Works for SaaS
In the fast-moving SaaS world, market conditions and customer demand can shift quickly. A new competitor, a pricing change, or a viral marketing campaign can significantly alter your sales trajectory in a short period. Exponential smoothing is perfect for this environment because it adapts quickly to these recent shifts, preventing your forecast from being overly influenced by outdated data from six or twelve months ago.
Actionable Insight: Imagine a SaaS like Slack launching a major new feature like "Clips". The immediate uptick in sign-ups from the launch campaign is a strong signal for the next quarter's performance. Exponential smoothing would heavily weight this recent data, providing a more aggressive and realistic forecast than a model that averages the entire past year.
How to Implement It
- Collect and Prepare Data: Start by exporting your historical sales data (like MRR or new customers per month) from your billing system. Ensure the data is clean and recorded at regular intervals.
- Select the Right Model:
- Simple Exponential Smoothing: Use this if your sales data is relatively stable without a clear trend or seasonal pattern.
- Holt-Winters Method: This is the go-to for most SaaS businesses. It incorporates variables for trend (the general direction of sales) and seasonality (predictable cyclical patterns).
- Choose Your Smoothing Parameters: The model uses smoothing constants (alpha, beta, gamma) that determine how much weight is given to recent data. A higher value (e.g., 0.7) makes the model more responsive to recent changes. Start with common values (e.g., 0.2 to 0.4) and test what provides the lowest error against your historical data.
- Generate the Forecast: Use a tool to apply the model. Spreadsheets like Excel (with the Analysis ToolPak) or Google Sheets can handle this, but specialized software like R or Python libraries provides more control and accuracy.
- Monitor and Adjust: Your forecast is not a "set it and forget it" tool. Compare your projections against actual sales data each month. If you see a consistent deviation, it's a sign that you need to adjust your smoothing parameters or re-evaluate the model.
3. Regression Analysis
Regression analysis is a powerful statistical method that moves beyond looking at just past sales. It aims to model the relationship between your sales (the dependent variable) and other influential factors (the independent variables). Think of it as creating a mathematical formula that explains how things like your marketing spend, website traffic, or even competitor pricing changes impact your revenue.
By identifying these key drivers, you can build a predictive model. For instance, you might discover that for every 1000 new website visitors from organic search, you generate 20 new trial sign-ups, which convert to $500 in new MRR. This technique gives you a formula to forecast future sales by plugging in your planned activities.
Why It Works for SaaS
This is one of the most effective sales forecasting techniques for SaaS companies looking to understand why sales go up or down, not just that they do. It helps you answer critical questions like, "If we double our content marketing budget, what's the likely impact on new trial sign-ups next quarter?" or "How much does a 10% increase in website traffic from organic search affect our enterprise leads?"
Actionable Insight: HubSpot built its empire on this. They know precisely the relationship between the number of blog posts published, the resulting organic traffic, the leads generated from that traffic, and the eventual new MRR. By using regression, their forecast isn't a guess; it's a direct output of their marketing plan. If they plan to publish 50 posts, they can forecast the revenue outcome.
How to Implement It
- Identify Potential Drivers: Brainstorm all the variables that could influence your sales. This could include internal factors (ad spend, number of sales reps, pricing) and external ones (seasonality, economic indicators). Start with 3-4 key drivers you can reliably track.
- Gather and Align Data: Collect historical data for your sales and each potential driver for the same time periods. For example, monthly ad spend and monthly new MRR for the last 24 months. Ensure data is clean and formatted consistently.
- Build the Model: Use a tool to run a regression analysis.
- Simple Linear Regression: Use this if you're testing the relationship between sales and just one other variable (e.g., sales vs. ad spend).
- Multiple Regression: Use this for modeling sales against several variables at once (e.g., sales vs. ad spend, website traffic, and sales headcount).
- Evaluate and Test: Check the statistical significance of your model. Look at metrics like the R-squared value, which tells you what percentage of the variation in your sales is explained by your chosen variables. A value over 0.70 is generally considered strong.
- Forecast and Refine: Use your model’s equation to predict future sales. For example, if your formula is
Sales = 5000 + (3 * Ad Spend) + (0.5 * Website Visitors), you can plug in your planned ad spend and expected traffic to get a forecast. Continuously update your model with new data to keep it accurate.
4. Qualitative Forecasting (Sales Force Composite)
Qualitative forecasting, often called the sales force composite method, is a bottom-up approach that leverages the frontline expertise of your sales team. Instead of relying purely on historical data, this technique involves asking individual salespeople to predict sales for their specific territories or accounts. These individual forecasts are then aggregated, or “rolled up,” to create a comprehensive, company-wide sales forecast.

This method taps into the invaluable, real-time insights your reps have about their deals. They know the customer's buying signals, the competitive landscape for a specific account, and the internal politics that might delay a signature. This ground-level intelligence provides crucial context that quantitative models often miss.
Why It Works for SaaS
For SaaS companies, especially in the B2B or enterprise space, the sales cycle can be long and complex. A sales rep’s gut feeling about a deal's likelihood to close is often based on subtle cues from weeks of conversations. This method captures that nuance. It's particularly effective for new products or market entries where historical data is scarce, forcing you to rely on the forward-looking judgment of your team.
Actionable Insight: Salesforce itself is a master of this. Their entire forecasting process is built around reps "calling their shot" for the quarter. Managers then add a layer of scrutiny, asking probing questions like "Who is the economic buyer you've spoken to?" and "What is the confirmed timeline for legal review?" This turns a rep's optimism into a vetted commitment.
How to Implement It
- Standardize Your Pipeline: Ensure every sales rep uses the same deal stages and probability-to-close percentages within your CRM (like Salesforce or HubSpot). This creates a common language for forecasting.
- Equip Your Team: Provide reps with a simple template or a dedicated CRM view to submit their forecasts. They should specify which deals they expect to close, for how much, and by when for the coming period (e.g., month or quarter).
- Conduct Forecast Calls: Sales managers must hold weekly one-on-one forecast calls. The goal is to challenge assumptions ("What gives you confidence this will close this month? What are the risks?") and add a layer of managerial oversight based on experience.
- Aggregate and Review: Roll up the individual forecasts from each rep into a team-level, then a department-level forecast. This aggregated number is the starting point for your company’s projection.
- Separate Forecast from Quota: To reduce bias (happy ears or sandbagging), decouple the forecast submission from compensation. The forecast is a planning tool, not a performance hammer. Track forecast accuracy as a coaching metric for reps who are consistently over or under.
5. Market Research and Surveys
Sometimes, the best way to predict what your customers will do is to just ask them. Market research is a sales forecasting technique that involves directly gathering insights from your target audience through surveys, interviews, and focus groups. Instead of relying solely on historical data, this qualitative method gauges future demand, customer intent, and purchasing behaviors straight from the source.
This approach is about systematically collecting data to understand the "why" behind potential sales. It’s particularly useful for new product launches, entering new markets, or when historical data is scarce or unreliable. It helps you understand market perception and potential adoption rates before you even have sales data to analyze.
Why It Works for SaaS
For SaaS companies, especially those in the early stages or launching new features, market research is invaluable. It helps you validate your product-market fit and understand the potential size of a new market segment. For instance, before building a major new integration, you could survey your existing users and prospects to gauge how many would be willing to pay for it and at what price point. This de-risks development and informs your initial sales forecast.
Actionable Insight: Before launching, Figma conducted extensive interviews and surveys with designers to understand their pain points with existing tools. By gauging their willingness to switch and pay for a collaborative, browser-based tool, they could build a pre-launch forecast based on direct user intent, not just guesswork about the total addressable market.
How to Implement It
- Define Your Objective: Be crystal clear on what you want to learn. Are you testing pricing for a new tier? Gauging demand for a new feature? Sizing a new international market? A specific question leads to a specific answer.
- Select Your Audience: Identify the right segment to survey. This could be your power users, prospects who fit your ideal customer profile (ICP), or even churned customers to understand their pain points. Using stratified sampling ensures your results are representative.
- Design Your Survey:
- Quantitative: Use tools like SurveyMonkey or Typeform to ask multiple-choice questions about purchasing intent ("On a scale of 1-10, how likely are you to purchase…"), feature importance, and price sensitivity.
- Qualitative: Conduct one-on-one interviews or small focus groups to get deeper, more nuanced feedback on their needs and problems. Record and transcribe these for later analysis.
- Analyze and Forecast: Aggregate the quantitative data to spot trends. For example, if 30% of 1,000 surveyed prospects say they are "very likely" (8-10 on the scale) to purchase your new product at $49/month, you have a solid, data-backed starting point for your forecast.
- Supplement and Validate: Be cautious of the gap between stated intent and actual behavior. Cross-reference survey findings with behavioral data from product analytics or initial sales from a soft launch. This feedback loop is also a great source for SaaS lead generation efforts as you're engaging directly with interested parties. Learn more about how to turn market insights into leads on saasoperations.com.
6. Pipeline Analysis
Pipeline analysis is one of the most fundamental and widely used sales forecasting techniques, especially for B2B SaaS companies with a structured sales process. This bottom-up method involves examining every deal currently in your sales pipeline, assessing its value, its current stage, and the probability of it closing. By summing up the weighted value of all open opportunities, you create a forecast grounded in the real-time activities of your sales team.
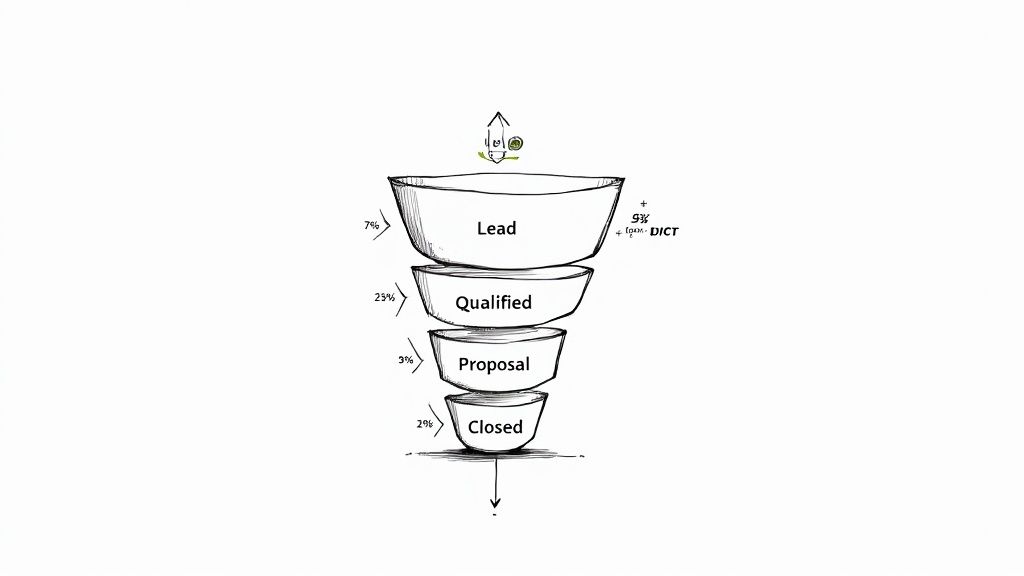
Unlike methods that rely purely on historical trends, pipeline analysis provides a forward-looking view based on tangible deals. If a deal is in the "Proposal Sent" stage with a historical close rate of 50%, a $20,000 ARR opportunity contributes $10,000 to the forecast. It’s a direct reflection of your sales team's current efforts and effectiveness.
Why It Works for SaaS
For SaaS businesses, particularly those with a mid-market or enterprise focus, the sales cycle can be complex and multi-staged. Pipeline analysis is perfect for this environment because it provides granular visibility. You can see exactly where deals are getting stuck, which stages have the highest drop-off rates, and how the overall health of your pipeline translates into future recurring revenue. It helps you manage your SaaS sales funnel with precision.
Actionable Insight: Atlassian's sales model relies heavily on a "land and expand" motion, which makes pipeline analysis critical. They don't just forecast new customer deals; they have separate weighted pipelines for cross-sells (selling Jira to a Confluence customer) and upsells (moving a team from Standard to Premium). This granular view gives them a much more accurate picture of future revenue.
How to Implement It
- Define Your Sales Stages: Clearly map out every step a lead takes from initial contact to closed-won, with strict exit criteria for each. For example, a deal can't move to "Demo Scheduled" until a time is confirmed on the calendar. Examples: "Initial Qualification," "Demo Scheduled," "Proposal Sent," and "Contract Negotiation."
- Assign Probabilities: Analyze historical data to determine the actual conversion rate from one stage to the next. For instance, what percentage of deals that receive a proposal ultimately close? Assign this data-driven win probability to each stage in your CRM.
- Calculate Weighted Value: For every open opportunity in your CRM, multiply its total contract value (ACV or TCV) by the win probability of its current stage. This gives you the "weighted pipeline value."
- Sum and Segment: Add up the weighted values of all deals expected to close within the forecast period (e.g., this quarter). You can further segment this by sales rep, product line, or lead source for deeper insights.
- Audit and Update Continuously: A pipeline forecast is only as good as the data in your CRM. Implement a weekly "pipeline hygiene" process where reps are required to update close dates, deal values, and stages for all their open opportunities.
7. Machine Learning and Artificial Intelligence
Stepping into the future, Machine Learning (ML) and Artificial Intelligence (AI) represent the most advanced sales forecasting techniques available. These methods use complex algorithms to analyze massive datasets, identifying subtle patterns and non-linear relationships that other models miss. Unlike static statistical models, ML models can learn from new data and automatically improve their prediction accuracy over time.
Think of it as having a data scientist on your team who never sleeps. ML can process dozens of variables simultaneously-from website engagement and in-app user behavior to macroeconomic indicators and competitor pricing-to generate incredibly nuanced forecasts. It’s how giants like Amazon and Netflix predict demand and subscriber growth with pinpoint accuracy.
Why It Works for SaaS
A SaaS business is a goldmine of data. ML models thrive on this, connecting dots between seemingly unrelated activities. For instance, an AI might discover that trial users who invite three or more teammates in the first 24 hours have a 90% conversion rate, a signal a human analyst might miss. This goes far beyond just looking at past revenue.
Actionable Insight: Gong.io uses its own AI to forecast. Their model analyzes the content of sales calls and emails, identifying key phrases, sentiment, and talk-to-listen ratios. It can predict the likelihood of a deal closing based not on what a rep enters in the CRM, but on what the customer is actually saying. This provides an unbiased, data-driven layer to their forecast.
How to Implement It
- Data Consolidation: Aggregate data from all your sources into a central data warehouse: CRM (deal stages, rep performance), billing platform (MRR, churn), product analytics (user engagement), and marketing automation (lead sources, website traffic).
- Feature Engineering: This is a crucial step where you select and transform the variables (features) that will be fed into the model. Start with clear hypotheses, such as "time spent in app during trial" or "number of support tickets created" as predictors of conversion.
- Choose a Model:
- Regression Models: (e.g., XGBoost, Random Forest) are excellent for predicting a continuous value like future revenue.
- Classification Models: Can be used to predict binary outcomes, like whether a specific lead will convert or a customer will churn.
- Train and Test: Split your historical data into a training set (e.g., 80% of data) and a testing set (20%). The model "learns" the patterns from the training data and you check its performance on data it hasn't seen before to validate its accuracy.
- Deploy and Monitor: Once you're happy with the model's accuracy, deploy it to generate live forecasts. Continuously monitor its performance against actuals and schedule regular retraining (e.g., quarterly) to incorporate new data. For more on this, you can learn more about AI and automation in SaaS operations.
8. Analogous/Comparable Company Analysis
Analogous or comparable company analysis is a sales forecasting technique straight from the venture capital and investment banking playbook. Instead of looking inward at your own historical data, this method looks outward. It involves forecasting your sales by benchmarking your company against similar businesses, or "comps," in your industry or a comparable market. By analyzing their growth trajectories, you can build a realistic forecast for your own startup.
This method is particularly powerful for early-stage SaaS companies that lack the extensive historical data needed for statistical models. It answers the question, "What does growth look like for a company like ours?" by studying the public filings of a SaaS company that IPO'd or the known metrics of a later-stage private competitor.
Why It Works for SaaS
This technique is a lifesaver for new SaaS entrants or those launching a product in a new category. When you have no past performance, the next best thing is the performance of a close peer. For example, a new B2B project management SaaS can analyze the early growth rates of companies like Asana or Monday.com (using their S-1 filings) to set a plausible target for their first two years, adjusting for market differences.
Actionable Insight: When Rippling was building its early financial models to raise capital, it didn't have years of data. Instead, its founders could point to the growth trajectories of first-generation HR tech leaders like Workday and Zenefits to create a defensible forecast, showing investors what "good" looked like in their market.
How to Implement It
- Identify Your Comps: Find 3-5 publicly traded or well-documented private SaaS companies. Look for similarities in business model (e.g., PLG vs. sales-led), average contract value (ACV), target customer (SMB vs. enterprise), and product category.
- Gather Performance Data: Collect key metrics like revenue growth rates, customer acquisition cost (CAC), and net revenue retention from their public filings (S-1s, 10-Ks), investor presentations, or market research reports from firms like Bessemer Venture Partners (BVP).
- Adjust for Differences: No two companies are identical. You must adjust the data for context. A comp that launched in 2015 had a different market environment than you do today. Account for differences in go-to-market strategy, geography, and market maturity.
- Build Your Forecast: Use the adjusted growth rates from your comps as a benchmark to project your revenue. For example, if comparable companies averaged 150% YoY growth in years 2-3, you can use that as a baseline for your own forecast, clearly documenting why you believe you can match or exceed it.
- Document Assumptions: Clearly state which companies you used as analogs and what adjustments you made (e.g., "We are forecasting a 20% faster growth rate due to our product-led growth model, which Asana did not have in its early years."). This transparency is crucial for building credibility with your team and potential investors.
9. Scenario and Sensitivity Analysis
Scenario and sensitivity analysis is a strategic forecasting technique that moves beyond a single prediction. Instead of trying to guess one right number, you create multiple forecasts (scenarios) based on different sets of assumptions. This method helps you understand the potential impact of key variables, preparing you for a range of possible futures, from best-case to worst-case scenarios.
This technique is about embracing uncertainty, not ignoring it. By modeling how your sales might react to a new competitor entering the market, a major feature launch, or a change in pricing, you can build more resilient and adaptable plans. It’s a core component of dynamic financial planning and one of the most powerful sales forecasting techniques for navigating a volatile market.
Why It Works for SaaS
The SaaS world is anything but stable. Customer acquisition costs can spike, a competitor might suddenly raise a massive funding round, or a new integration could unlock a previously untapped market. Scenario analysis is perfect for this environment. It allows a SaaS operator to model the potential MRR impact of a successful marketing campaign (optimistic scenario) versus a major service outage (pessimistic scenario), giving leadership a clear view of both risks and opportunities.
Actionable Insight: During the 2020 pandemic, SaaS companies like Zoom had to rapidly model new scenarios. Their base case forecast became obsolete overnight. They built an optimistic scenario ("What if remote work adoption triples?") and a pessimistic one for churn ("What if small businesses fail and cancel subscriptions en masse?"). This allowed them to make aggressive hiring and infrastructure decisions with a clear understanding of the potential risks.
How to Implement It
- Identify Key Variables: Pinpoint the 3-5 most influential drivers of your sales. For a SaaS business, this could be trial-to-paid conversion rate, monthly marketing budget, customer churn rate, or even the price of a key software integration.
- Define Your Scenarios: Create a limited number of distinct scenarios. The most common approach is a three-pronged model:
- Pessimistic: What if our top competitor slashes prices and our churn rate increases by 20%?
- Base Case (Realistic): Business as usual, based on your most likely assumptions and historical trends.
- Optimistic: What if our new feature goes viral and our conversion rate jumps by 15%?
- Build the Models: Create a separate forecast for each scenario in a spreadsheet or your FP&A tool like Pigment or Causal. Clearly document every assumption that goes into each model so you can explain the differences.
- Perform Sensitivity Analysis: Tweak one key variable at a time within your base case model to see how sensitive your forecast is to that single change. For instance, see how a 5% change in churn affects your end-of-year ARR. This helps identify your most critical levers.
- Review and Strategize: Use the outputs to build action plans. If the pessimistic scenario is catastrophic, what steps can you take now to mitigate that risk (e.g., launch a customer retention campaign)? If the optimistic case is achievable, what resources do you need to make it happen (e.g., pre-approve marketing hires)? Explore how different revenue forecasting methods on saasoperations.com can be integrated into your models.
10. Moving Average and Weighted Average Methods
Moving average and weighted average methods are foundational sales forecasting techniques that smooth out short-term noise in your sales data to reveal the underlying trend. Instead of getting bogged down by a single unusually high or low sales month, these methods look at the average performance over a set period, providing a more stable and realistic picture of where your sales are headed.
A moving average calculates the average of sales data over a specific number of past periods (like 3 or 6 months). A weighted moving average takes this a step further by assigning more importance, or weight, to more recent data points, making the forecast more responsive to recent changes in sales performance. These methods are simple to implement and understand, making them a great starting point for any SaaS business.
Why It Works for SaaS
For early-stage SaaS companies or those with inconsistent monthly sales, these methods are a lifesaver. They cut through the volatility of individual month-to-month results-perhaps a big annual deal closed in March, or a marketing campaign flopped in July. By averaging performance over a quarter or a six-month period, you get a much clearer signal of your true growth trajectory, helping you avoid overreacting to temporary blips.
Actionable Insight: An early-stage PLG SaaS might see highly variable new MRR each month. A 3-month moving average smooths this out. If new MRR was $5k, $15k, and $7k, the single-month data is noisy. The 3-month average is $9k, providing a more stable baseline for forecasting the next month's performance and setting realistic marketing budgets.
How to Implement It
- Collect Consistent Data: Pull your historical sales data, such as Monthly Recurring Revenue (MRR) or the number of new subscriptions, for at least the last 12-24 months. Ensure the data is recorded at regular intervals (e.g., monthly).
- Calculate the Simple Moving Average (SMA): To calculate a 3-month moving average for April, you would sum the sales from January, February, and March and then divide by 3. You'd repeat this process for each subsequent month in a spreadsheet.
- Implement a Weighted Moving Average (WMA): Decide on the weights. For a 3-month WMA, you might assign a weight of 3 to the most recent month, 2 to the second most recent, and 1 to the third. Multiply each month's sales by its weight, sum the results, and divide by the total of the weights (in this case, 3+2+1=6).
- Visualize and Analyze: Plot your actual sales data against both the 3-month and 6-month moving averages. This visualization will help you see the underlying trend more clearly and determine which period length best smooths your data without hiding important changes.
- Forecast and Iterate: Use the calculated average as the forecast for the next period. As new sales data becomes available, update your calculations by dropping the oldest data point and adding the newest one. This is easily automated in Google Sheets or Excel.
10-Method Sales Forecasting Comparison
| Method | Complexity 🔄 | Resources & Speed ⚡ | Effectiveness ⭐ | Results / Impact 📊 | Ideal use cases 💡 |
|---|---|---|---|---|---|
| Time Series Analysis | 🔄🔄 | Moderate historical data required (2–3+ years); moderate compute ⚡⚡ | ⭐⭐⭐⭐ | High accuracy for stable, seasonal demand | Retail seasonality, utilities, established SKUs — use moving averages and update regularly |
| Exponential Smoothing | 🔄🔄 | Low historical data; very fast to compute ⚡⚡⚡ | ⭐⭐⭐⭐ | Responsive short‑term forecasts, adapts to recent changes | Fast‑moving goods, perishables, short‑term inventory planning — tune alpha / use Holt‑Winters for seasonality |
| Regression Analysis | 🔄🔄🔄 | Requires external variables and statistical expertise; moderate compute ⚡⚡ | ⭐⭐⭐⭐ | Quantifies drivers and enables what‑if scenarios | Pricing, marketing impact, B2B revenue modeling — validate with train/test and check multicollinearity |
| Qualitative Forecasting (Sales Force Composite) | 🔄🔄 | High human effort; CRM processes; slower aggregation ⚡ | ⭐⭐⭐ | Strong contextual insight but variable accuracy | Enterprise sales, long sales cycles, complex accounts — standardize templates and separate compensation from forecasts |
| Market Research & Surveys | 🔄🔄🔄 | Expensive and time‑consuming; moderate analysis effort ⚡ | ⭐⭐⭐⭐ | Direct customer intent and segmentation insight; good for launches | New product launches, market entry, segmentation — use stratified sampling and combine with behavioral data |
| Pipeline Analysis | 🔄🔄 | Needs disciplined CRM data and ongoing updates; near‑real‑time dashboards ⚡⚡ | ⭐⭐⭐⭐ | Good near‑term revenue visibility; highlights bottlenecks | SaaS/enterprise B2B, quota management — define stages clearly and use historical conversion rates |
| Machine Learning & AI | 🔄🔄🔄 | High data, infrastructure and talent needs; can operate real‑time ⚡⚡ | ⭐⭐⭐⭐⭐ | Very accurate with large/clean datasets; captures complex non‑linear patterns | Large retail, dynamic pricing, real‑time demand forecasting — use ensembles, retrain regularly, apply explainability tools |
| Analogous / Comparable Analysis | 🔄🔄 | Requires access to peer data and benchmarking; moderate effort ⚡ | ⭐⭐⭐ | Provides market benchmarks when internal history is limited | Startups, valuations, new market entrants — use multiple comparables and adjust for key differences |
| Scenario & Sensitivity Analysis | 🔄🔄🔄 | Moderate modeling effort and stakeholder time; iterative ⚡ | ⭐⭐⭐⭐ | Clarifies risks, quantifies variable impact, supports contingency planning | Strategic planning, stress tests, capital allocation — limit to 3–5 scenarios and document assumptions |
| Moving Average / Weighted Average | 🔄 | Minimal data and compute; very fast ⚡⚡⚡ | ⭐⭐⭐ | Simple smoothing; lags turning points; good baseline | Small businesses, quick baselines, initial forecasts — test window lengths and combine with trend analysis |
From Technique to Traction: Making Your Forecast a Growth Engine
Alright, we've just navigated a deep dive into the world of sales forecasting techniques, from the old-school reliability of Time Series Analysis to the futuristic power of AI and Machine Learning. It’s a lot to take in, but remember this: the goal isn't to become a master statistician overnight. The goal is to find the right tool for the right job at your current stage of growth.
A seed-stage SaaS with a small sales team might find immense value in a simple Pipeline Analysis or a Qualitative Forecast built from the ground up by the reps who live in the trenches every day. In contrast, a Series C company sitting on years of historical data would be leaving money on the table by not leveraging more sophisticated methods like Regression Analysis or ML-powered models to uncover hidden patterns.
The most critical takeaway is that a sales forecast isn't a static report you create once a quarter to satisfy the board. It's a living, breathing component of your operational rhythm. It’s the connective tissue that links sales, marketing, finance, and product together, ensuring everyone is building toward the same predictable future.
Turning Theory into Tactical Wins
So, where do you go from here? Don't get paralyzed by the ten different options we've laid out. The key is to start small, build momentum, and iterate.
Here’s a simple, actionable game plan:
- Pick Your Player(s): Choose just one or two sales forecasting techniques that align with your available data and business maturity. If you're pre-product-market fit, Market Research and Analogous Analysis are your best friends. If you have a solid, repeatable sales motion, start with Pipeline Analysis and layer in a Moving Average method.
- Establish a Cadence: Forecasting isn't a project; it's a process. Decide on a rhythm, whether it's weekly for sales leaders or monthly for the executive team. Schedule a recurring meeting to review your forecast, compare it against actual performance, and dissect the deltas. Why did we over-perform? Where did we miss?
- Document Everything: Create a simple Standard Operating Procedure (SOP). What data goes in? Who is responsible for providing it? What are the definitions and exit criteria for each pipeline stage? This removes ambiguity and makes the process repeatable, even as your team grows and changes.
- Track Your Accuracy: You can't improve what you don't measure. Calculate your forecast accuracy over time (e.g.,
1 - (|Actual - Forecast| / Actual)). An accuracy rate of 85-95% is a great target, but the most important thing is to see the trend improving as you refine your inputs and assumptions.
Actionable Insight: The best SaaS operators treat their sales forecast not as a prediction, but as a diagnostic tool. When reality deviates from the forecast, they don't just adjust the numbers; they dig deep to understand the why behind the variance. This uncovers valuable insights about their sales process, marketing effectiveness, and market dynamics, turning a miss into a lesson.
Ultimately, mastering these forecasting methods is about more than just hitting a number. It’s about gaining control over your growth trajectory. An accurate forecast allows you to hire with confidence, invest in marketing with precision, and manage cash flow without sleepless nights. Once you have your forecasting techniques in place, you can apply these insights as powerful data-driven revenue optimisation techniques to fuel your growth engine. It transforms your go-to-market strategy from a guessing game into a well-oiled machine, turning your forecast into a true engine for scalable, predictable growth.
Ready to stop guessing and start building a predictable revenue machine? The templates, playbooks, and SOPs at SaaS Operations give you the battle-tested frameworks to implement these techniques immediately. Stop reinventing the wheel and start scaling faster with SaaS Operations.