Your Quarterly Business Review Template Free Download
Tired of scrambling to throw together a Quarterly Business Review at the last minute? We’ve all been there. If you need a quarterly business review template free of charge, you're in the right place. You can generate a custom, SaaS-focused QBR template right now and finally build a solid framework for those critical client conversations.
End the QBR Scramble with Your Free Template
Let's be real—preparing for a QBR often feels like a full-blown fire drill. It’s a familiar scene for SaaS operators: wrestling with data from ten different places, trying to patch together a coherent story, and rushing to finish just hours before the big meeting.
This kind of chaotic, unstructured process almost always leads to the same old frustrations:
- A Jumbled Story: When every QBR deck is different, it’s impossible to show progress over time. You lose the cohesive narrative that demonstrates your value.
- Wasted Prep Time: Customer Success Managers end up reinventing the wheel every single quarter. That’s time they could have spent digging for real insights, not just formatting slides.
- Shallow Conversations: A simple data dump leads to a "what happened" conversation. You never get to the far more important question: "What should we do next?"
The Antidote to QBR Chaos
The fix is surprisingly simple: standardize your process with a proven framework. A well-designed template is your playbook. It ensures every client review is consistent, insightful, and focused on the future.
This is why having a go-to quarterly business review template free to download is such a game-changer for SaaS teams. It turns the QBR from a dreaded chore into your best tool for proving value, which is everything when it comes to retention and expansion. While you’re focused on QBRs, it’s also worth checking out a variety of free templates that can help organize other parts of your work and life.
You don't just need a static file; you need a tool that builds the exact template you need. That's what our generator does.

This isn’t just some one-size-fits-all PDF. It’s a dynamic generator that builds a QBR structure based on what you actually need to present. It’s about seamlessly blending your data with a story that actually connects with your client.
The single biggest mistake SaaS operators make is treating the template as a report card. A QBR is not just a data dump of what happened. Your template is the foundation for a strategic discussion, not the entire meeting.
Ready to stop the mad dash and start building better client partnerships? Generate your custom framework now with our free quarterly business review template generator and start making your client meetings count.
Building Your QBR: A SaaS Playbook
Grabbing a free quarterly business review template is a great starting point, but let’s be real—a template is just a blank canvas. The real value comes from the story you paint on it. A QBR isn't just a laundry list of your accomplishments; it's a narrative about partnership, progress, and what’s possible next.
Think of your presentation as a story with a beginning, middle, and end. You're taking your client on a journey, showing them where they started, where they are now, and the exciting places you can go together.
To make this tangible, let's imagine you're a Customer Success Manager for "AnalyzeMe," a B2B analytics platform, and you're prepping for a QBR with a major client.
Nail The Executive Summary
Your first slide has one job: grab their attention. Don't bury the lead. This is the TL;DR ("Too Long; Didn't Read") moment that frames the entire conversation and shows you respect their time.
You want to hit three key points, fast:
- The single biggest win from the last 90 days.
- The most important challenge or lesson we learned.
- The one thing we need to focus on next quarter.
Our CSM from AnalyzeMe might kick things off like this: "This quarter, your team's adoption of the 'Sales Funnel Visualization' feature drove a 15% increase in lead-to-close rates. We also hit a snag with CRM data integration that we need to tackle. So, our main focus for the next quarter is automating that data flow to unlock even deeper insights."
See what that does? It immediately proves value, acknowledges a real-world problem, and sets a clear, collaborative path forward.
Get Real About Last Quarter's Goals
Now it's time to look back at the goals you set together last time. This is all about accountability. It's so tempting to only focus on the good news, but trust is built in the trenches. You have to be upfront about what worked and what didn't.
A simple "Goal vs. Actual" layout is perfect here. For instance, a goal for AnalyzeMe might have been to "Increase user adoption among the sales team by 20%." The result? "Success! We hit 25% adoption." But what if another goal was to "Reduce report generation time by 30%"? The honest answer might be, "We only got a 10% reduction due to an unexpected API issue." That kind of transparency is gold.
A QBR isn't a report card where you're trying to get an 'A'. It's a strategic alignment session. Glossing over challenges or missed goals prevents you from solving the very problems you were hired to fix.
Tell a Story with Your KPIs
Data without context is just noise. Every Key Performance Indicator (KPI) you share has to tie directly back to what the client actually cares about—their business goals. A chart showing "Daily Active Users" is meaningless on its own.
Instead of just showing the graph, the AnalyzeMe CSM would frame it with a story: "We saw a 40% spike in daily logins during the last two weeks of the quarter. This lines up perfectly with your sales team's end-of-quarter push, which tells us they're now relying on our platform for their most critical reporting." Suddenly, a vanity metric becomes a powerful statement about value.
Creating these frameworks over and over is the key to scaling your success. You can dive deeper into this by learning how to build effective SaaS playbooks.
Unpack the Wins and Roadblocks
This is where you shift from the "what" to the "why." For every big win, break down how it happened. Was it a new feature they loved? A great training session? An internal champion on their team who drove adoption? Pinpointing the cause helps you make success repeatable.
Even more crucial is doing a post-mortem on the roadblocks. The AnalyzeMe CSM could explain, "The reason we missed the report-generation-time goal was an API rate limit in the current CRM that we didn't see coming. That's a lesson learned for us, and it’s why our top priority is now working with your IT team on a better integration." This turns a "failure" into a shared learning moment with a clear action item.
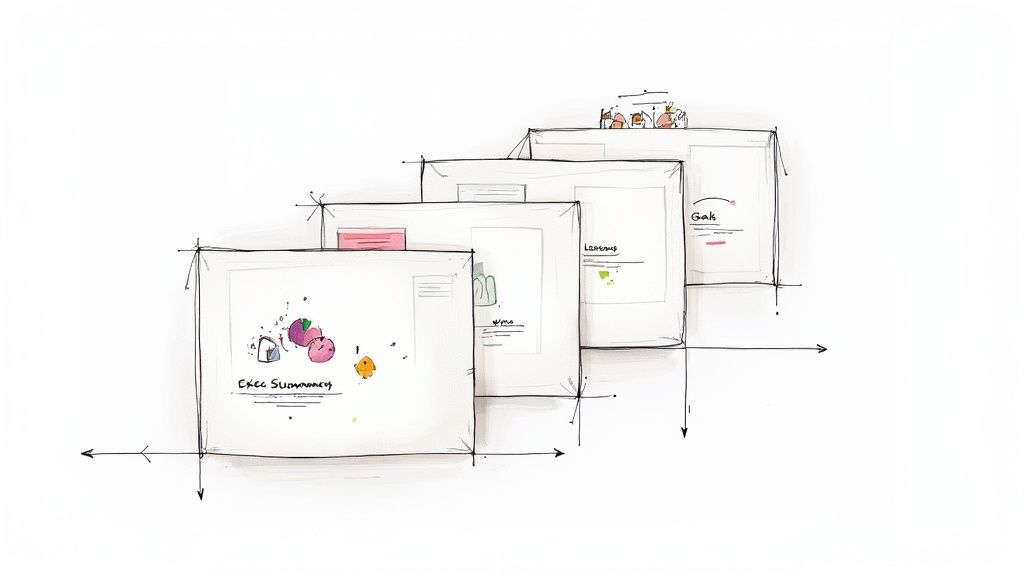
To tie this all together, here's a simple structure you can follow to build out the core narrative of your QBR.
Essential SaaS QBR Slide Structure
Think of this table as your cheat sheet for crafting a QBR that flows logically and hits all the right notes, turning data into a compelling story of partnership.
| Slide Section | Core Purpose | Example Key Metric |
|---|---|---|
| Executive Summary | Hook the audience with the main takeaway upfront. | "Achieved 15% ROI on ad spend analysis." |
| Goal Review | Build trust through transparent accountability. | Goal: 100 trained users. Actual: 112 trained users. |
| Key KPIs & Insights | Connect your platform's data to their business outcomes. | Feature Adoption Rate leading to process efficiency. |
| Wins & Roadblocks | Explain the 'why' behind the results and learnings. | "Win: New dashboard saved 10 hours/week." |
| Next Quarter's Goals | Co-create a forward-looking action plan. | "Goal: Integrate with new marketing automation tool." |
Following this flow turns your quarterly business review template from a simple document into a powerful tool for strategic alignment. It ensures every meeting strengthens the partnership and drives real, measurable progress for your customer.
Choosing Metrics That Actually Matter In SaaS
When you sit down for a QBR, data without direction falls flat. You want numbers that tie back to your client’s real goals, not just your product roadmap. Aligning KPIs with business outcomes shifts the focus from “features used” to “value delivered.”
Top SaaS teams sort metrics into three buckets:
- Adoption & Engagement
- Value & ROI
- Account Health
This simple framework keeps your QBR sharp and paints a full picture of success.
Adoption And Engagement Metrics
Think of these as your usage radar. They show what features stick and where you need to intervene.
- Feature Adoption Rate tracks who’s really using core functionality.
- Daily Active Users gives a broad view of engagement but not depth.
- Module Stickiness measures repeat visits on key workflows.
At one B2B analytics firm, a 20% jump in feature adoption delivered 30% more customer value. And over at DataFlow, a sharp focus on that same metric drove a 12% drop in churn within three months.
Value And ROI Metrics
Clients love metrics they can translate into dollars and cents. When you tie your SaaS platform to cost savings or revenue uplift, QBRs instantly go from technical reviews to boardroom conversations.
Tracking ROI in dollar terms turns your meeting into a financial discussion.
- Cost Savings Realized compares expenses before and after automation.
- Revenue Influenced shows net sales uplift thanks to your platform.
- Payback Period reveals how quickly a client recoups subscription fees.
For example, AnalyzeMe framed their quarterly ROI by showing a 25% boost in sales influenced. The result? Instant credibility and a smoother renewal chat.
Account Health Metrics
These numbers are your early-warning system. They flag friction points and help you act before renewals come up.
- Support Ticket Trends highlight recurring issues that could erode trust.
- Product Feedback Scores track satisfaction for each release.
- Net Promoter Score uncovers loyalty and referral potential.
Why Choosing The Right Mix Matters
Relying solely on engagement metrics risks leaving value unproven. And chasing ROI alone can ignore usage gaps that spell churn. A balanced set of KPIs lets you:
| Metric Category | Example Metric | Why It Matters |
|---|---|---|
| Adoption & Engagement | Feature Adoption Rate | Shows true tool usage |
| Value & ROI | Revenue Influenced | Links usage to bottom line |
| Account Health | Net Promoter Score | Predicts loyalty and referral potential |
Embedding live dashboards ups the ante on transparency. Tools like Tableau or Looker slid right into QBR decks and give clients real-time access to metrics like MQLs, churn rate, NPS, and revenue impact. Check out Qwilr’s guide to see how they do it.
For a quick refresher on essential SaaS benchmarks, dive into our write-up on SaaS KPIs. And if you want the lowdown on measuring client success, you can’t miss this deep dive into client success metrics.
When you pair these metrics with our free quarterly business review template generator, you'll ensure every slide drives strategic dialogue.
Putting Metrics Into Practice
Begin by mapping each KPI to a specific customer objective. Use adoption numbers to highlight user growth. Lean on ROI figures to fuel renewal talks. And monitor health stats to catch risks early.
- Align objectives with stakeholders and pick your KPIs together
- Embed live charts from your BI tool straight into the deck
- Scan trends monthly so you’re always QBR-ready
Metrics without context are just numbers on a slide.
Pair this playbook with our free quarterly business review template generator to streamline preparation and make every QBR a milestone.
How to Prepare and Present Your QBR
When a QBR feels like a one-way speech, you lose your audience. Treat it as a joint workshop instead of a slide deck monologue. Start by pulling insights from Sales, Product, and Customer Success into a shared document. This simple step surfaces trends early and stops last-minute data scrambles.
A crisp agenda sets the tone and shows you respect everyone’s schedule. Try this outline:
- Pre-Meeting Stakeholder Check-In: Confirm goals and flag any new topics.
- Data Consolidation: Gather all metrics into one dashboard using your quarterly business review template generator from SaaS Operations.
- Internal Rehearsal: Walk through the deck with your core team 48 hours before showtime.
Locking in a repeatable QBR framework pays dividends every quarter. Dock.us found that a consistent template slashes prep chaos and makes meetings far more effective. Dive into the details on Dock.us.
Crafting A Compelling Narrative
Raw numbers only resonate when you wrap them in context. Open with a real client win—say, a new integration that cut manual work by hours each week. Then let your metrics tell the rest of the story.
When you spot a spike in adoption, tie it to revenue gains or cost savings. That shift takes the conversation from “what happened” to “what’s next.”
Be transparent about hiccups, too. A brief “fail-forward” recap—what didn’t go as planned and how you adjusted—builds credibility and fuels collaborative planning.
Visualizing Key SaaS Metrics
Before unveiling this infographic, explain why it matters: it maps out how feature engagement drives ROI and overall account health.
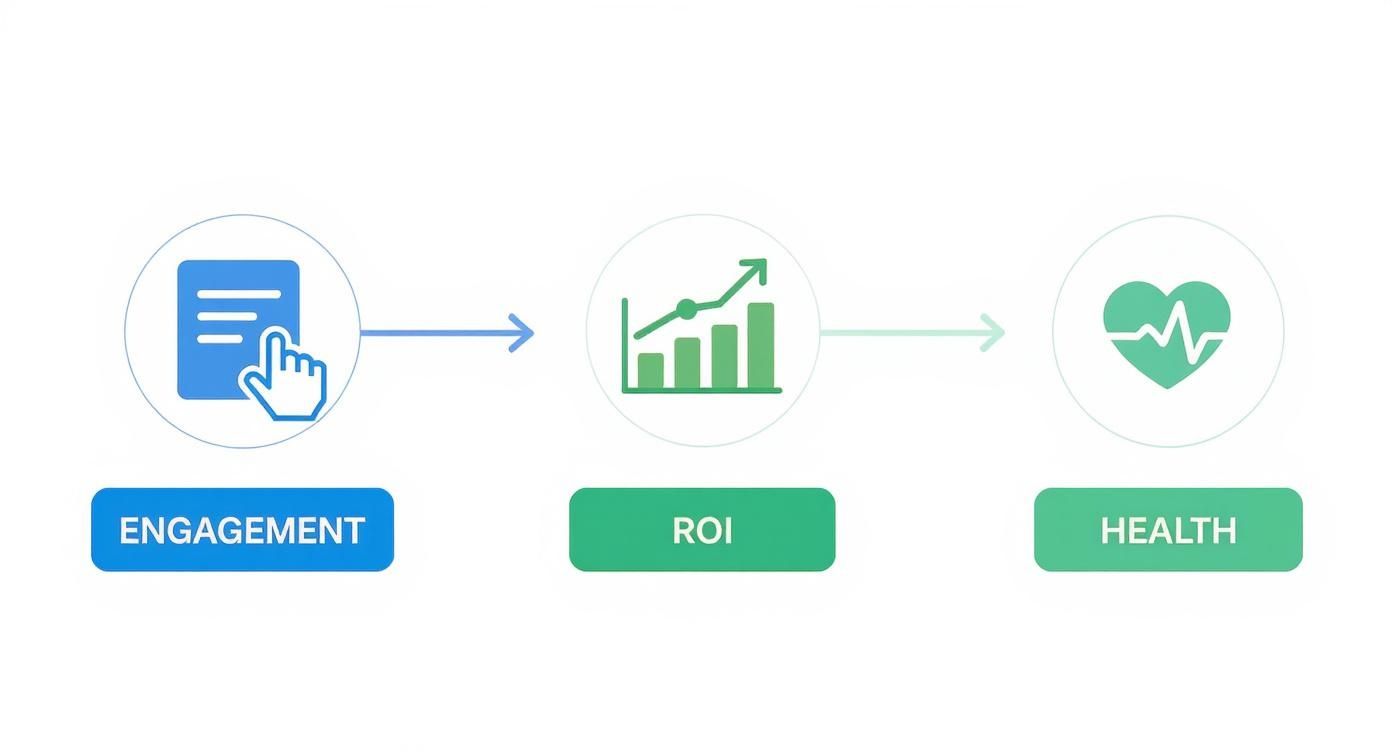
This visual anchors your QBR in concrete outcomes—feature clicks, ROI shifts, and health trends. To make it interactive, sprinkle in a quick poll or invite real-time annotations. Turning a slide deck into a workshop keeps energy high. Learn how to run truly collaborative sessions in our guide on effective meetings.
Facilitating Two-Way Dialogue
An effective QBR sparks conversation, not just presentation. Kick off with a poll like “Which feature had the biggest impact this quarter?” Then split into breakout groups and capture ideas instantly using a shared Mural board or Google Doc.
- Pose a challenge—data integration, for example—and let teams propose fixes.
- Ask each group to present one actionable idea.
- Vote live on the top three priorities to build consensus.
This format turns your QBR into a strategy workshop. Assign roles to keep things flowing smoothly: the CSM steers the story, Sales adds the commercial context, and Product handles technical deep dives.
Treat every QBR as a partnership summit, not just another vendor check-in.
As ideas surface, log action items in a shared doc so moving to next steps feels seamless.
Next Steps And Follow-Up
Your QBR’s impact hinges on follow-through. Send a concise recap email within 24 hours that highlights decisions, owners, and deadlines. Then schedule a 15-minute mid-quarter check-in to clear blockers and keep momentum going.
- Summary Email: One-page PDF showcasing the top three takeaways.
- Assigned Tasks: Record owners and due dates in your CRM.
- Mid-Quarter Sync: Quick touch-base to track progress.
With a clear SOP for follow-up, your QBR becomes more than a discussion—it turns into measurable, ongoing progress.
The Follow-Up Process That Drives Action
It’s easy to leave a QBR feeling pumped, only to have that energy fizzle out when follow-up falls through the cracks. A solid post-QBR routine keeps everyone on track—and ensures those good intentions turn into real outcomes.
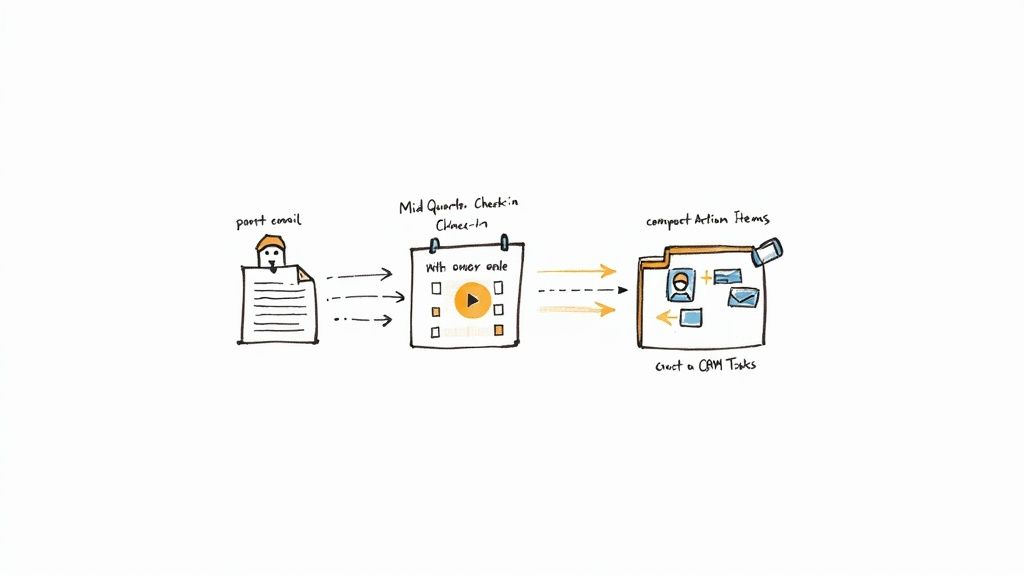
This SOP zeroes in on three critical moves: sending a recap within 24 hours, logging tasks with clear owners and due dates, and carving out a mid-quarter check-in. Nail these, and you’ll transform promises into progress.
Key Follow-Up Steps
-
Summary Email Within 24 Hours
Jot down decisions and next steps in a one-page memo that stakeholders can skim instantly. -
Assign Owners And Deadlines
Plug tasks into your CRM or project tool, tag the responsible person, and set realistic dates. -
Mid-Quarter Check-In
Block out 15-minute touch-base around week six to remove blockers and update status.
A simple checklist keeps nothing slipping through the cracks. Templates speed you up. And most importantly, clients see you’re reliable.
Writing A Clear Summary Email
Craft a brief email that highlights the top three takeaways—decisions made, tasks to tackle, and next steps. Bullet points are your friend here.
Sending your summary quickly shows urgency and respect for everyone’s time.
Don’t forget to include a link to the finished QBR slides or your favorite quarterly review template generator so folks can drill into details later.
Assigning Owners And Deadlines
Within one business day, record each action item in your CRM. Tag who’s doing what and set a realistic due date. This single source of truth prevents confusion and follow-up threads.
- Create a custom “QBR Task” field in your CRM
- Assign tasks with context so no one’s guessing
- Set reminders to nudge assignees before deadlines
Visibility is everything. When everyone knows their deliverables, nothing gets lost in the shuffle.
Scheduling Mid Quarter Check In
Grab a 30-minute slot on the calendar about six weeks after the QBR. Keep it laser-focused—no full rehash, just progress updates.
| Check-In Focus | Purpose | Duration |
|---|---|---|
| Progress Update | Review completed tasks and roadblocks | 10 minutes |
| Risk Assessment | Spot new challenges early | 10 minutes |
| Next Actions | Adjust timelines or resources | 10 minutes |
These early feedback loops nip surprises in the bud and reinforce accountability.
Real World Follow-Up Example
At BrightMetrics, the CSM fired off their summary in under two hours and saw a 30% faster task completion rate. They leaned on Salesforce to tag tasks and held a 20-minute mid-quarter sync. The result? They caught an integration glitch early, avoiding a 20% launch delay.
Integrate this SOP into your broader workflow. Check out our guide on gap analysis to tighten your strategy and prevent execution gaps. Learn more about conducting a gap analysis in our template guide.
Putting this follow-up process in place takes just minutes—but the payoff lasts all quarter. Keep everyone aligned, and your QBR will become the launchpad it deserves to be.
Ready to lock in your routine? Pair this SOP with our free quarterly business review template generator and keep the momentum rolling after every review.
Common QBR Questions Answered
It’s easy to default to a “quarterly” review just because the label fits. Yet, not every customer needs a full sit-down every 90 days. For high-touch enterprise deals, those in-depth sessions are non-negotiable—at BrightMetrics, shifting top-tier clients to a true quarterly rhythm lifted renewal rates by 20%.
- Enterprise accounts: full QBR every three months
- Mid-market clients: biannual deep dives plus quick check-ins in off-quarters
- Low-touch segments: automated email summaries of key metrics
- Flexible cadence: match frequency to customer tier and business impact
Customizing Your QBR Cadence
Mid-market customers often get the most bang from a twice-a-year deep dive, spiced up with a short check-in call or email. That light touch keeps things moving without clogging calendars.
For lower-touch tiers, fire off automated summaries through our free quarterly business review template generator. It slashes prep time and nails a consistent structure that builds trust—trust that powers renewals.
Don’t forget to watch out for schedule overload. Use engagement heat maps to spot when folks are most active and plan around those windows.
Who Absolutely Needs To Be In The QBR Meeting
Bringing the right crew turns slides into real decisions. Your Customer Success Manager leads the story. An Account Executive adds commercial context and flags upsell moments.
- Day-to-day contact: keeps tactical follow-ups on track
- Decision-maker or budget owner: empowers commitments
- Product or technical lead: clears up integrations and roadblocks
- Executive sponsor: signals high-level alignment and support
A balanced guest list sparks strategic alignment and action.
Setting Stakeholder Expectations
Shoot a clear agenda a week out, outlining each person’s role. A focused prep email three days before slashes late cancellations by 25%.
Include bullet points of the exact questions you want answered. When stakeholders know what to prep, the conversation stays laser-focused and moves faster.
What Is The Biggest Mistake People Make With QBR Templates
Too many teams treat their QBR deck like a static report card instead of a conversation starter. They cram every metric in and breeze past what comes next—turning strategy time into a snooze fest.
- Mistake: Data dump of historical activity
Fix: Spotlight three key insights and tie each to strategic decisions - Mistake: One-way presentation
Fix: Pause for feedback loops and co-create next steps - Mistake: Uniform slides
Fix: Add interactive polls or breakout discussions for real engagement
A template should be your playbook for conversation, not a checklist for perfection.
Case Study Avoiding Common Pitfalls
AnalyzeMe kicked off with a flat QBR deck that felt like reading from a script. They slipped in a two-minute live poll on which feature impact mattered most and saw active participation jump by 50%.
- Initiative: Quick poll on integration roadblocks
- Outcome: 3x more feedback from client teams
- Next Step: Incorporate a collaborative Mural board for real-time ideas
Small interactive tweaks can spark big engagement shifts.
Use this template to streamline your prep, rally stakeholders, and deliver measurable impact every quarter. It even includes slide examples, KPI prompts, and follow-up SOPs built in. These pointers will help you transform your QBR from a report back into a roadmap forward.
Next, download our free quarterly business review template generator to put these best practices into action and kick off your next QBR with confidence. Pair it with a mid-quarter check-in to catch issues early.
Explore the SaaS Operations platform at saasoperations.com