Using a Growth Potential Calculator to Find Your Ceiling
Ever feel like your SaaS is sprinting on a treadmill? You're pouring money into marketing, celebrating every new sign-up, yet your total customer count barely budges. That frustrating plateau is a classic sign you've hit your SaaS growth ceiling.
A growth potential calculator is the tool that reveals this ceiling—the absolute maximum number of customers your business can handle with its current acquisition and churn rates. It’s a dead-simple calculation that tells you if you're building a scalable business or just spinning your wheels. The best place to start is with a tool, like our free Growth Ceiling Calculator, to get an instant diagnosis.
What Is Your SaaS Growth Ceiling Anyway?
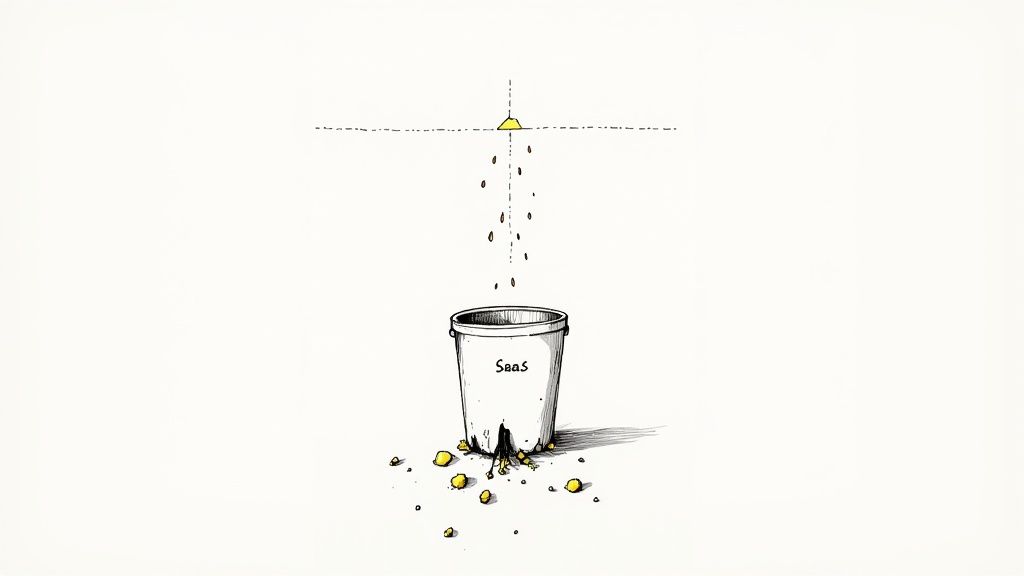
Think of your business as a bucket. New customers are the water you pour in, while customer churn represents the leaks. No matter how fast you turn on the hose (your acquisition efforts), you'll never actually fill the bucket if you don’t plug the holes (churn).
Your growth ceiling is simply the point where the water coming in equals the water leaking out. At that point, growth flatlines. The growth potential calculator is what measures the size of your bucket and the severity of its leaks, telling you exactly how full it can ever get.
Moving Beyond the Acquisition Treadmill
So many SaaS operators fall into the trap of focusing only on acquisition. They live and die by metrics like MQLs, SQLs, and conversion rates, convinced that more top-of-funnel activity is the only way to grow. And while getting new customers is obviously vital, this tunnel vision often hides a deeper, more destructive problem.
"I once worked with a founder who was spending $50k a month on ads to acquire customers who were churning out 90 days later. They were essentially renting customers, not building a business. Identifying their growth ceiling was the wake-up-call they needed to shift focus from acquisition to retention." – SaaS Operations Expert
This story is incredibly common. Without a clear picture of your growth ceiling, you can easily burn through cash to sign up customers who won't stick around. It’s an expensive, unsustainable cycle—the business equivalent of trying to outrun a bad diet at the gym. It’s exhausting and, in the end, it just doesn’t work.
Why Every SaaS Operator Needs to Know Their Ceiling
Calculating your growth ceiling brings instant clarity and strategic direction. It forces you to look at the two most critical levers in your business—acquisition and retention—and see how they actually work together.
This one calculation helps you:
- Diagnose Stagnation: Finally understand why growth has stalled, moving from guesswork to a data-backed diagnosis.
- Prioritize Resources: Decide whether your team should double down on acquisition or tackle churn to get the biggest bang for your buck.
- Set Realistic Goals: Align your growth targets with what’s mathematically possible with your current model. No more wishful thinking.
- Improve Forecasting: Predict future customer counts with way more accuracy, which helps with everything from hiring to budgeting.
Understanding this limit is a huge step in your company’s operational maturity. To see where this fits into the bigger picture, you can check out our guide on the SaaS maturity model. It helps you figure out which stage your business is in and what to focus on next. Knowing your ceiling is a cornerstone of that journey.
How a Growth Potential Calculator Actually Works
Let's pull back the curtain. A growth potential calculator isn't some complex, mystical tool. At its heart, it’s powered by a surprisingly simple formula that connects the two most vital metrics for any SaaS business: how many customers you bring in versus how many you lose.
The core of it is this: Growth Ceiling = New Customers Per Month / Customer Churn Rate. That's it. This one equation shows you the absolute maximum number of customers your business can handle with its current setup. It’s the equilibrium point where the customers you gain are perfectly canceled out by the customers who leave.
Breaking Down the Inputs
To get started, you only need two numbers from your own business. The key is making sure they’re accurate and based on a consistent period, like the last month or a three-month average.
- New Customers Per Month: This one’s easy. It's the total count of new, paying customers you sign up in a given month. I recommend using a three-month average to smooth out any random good or bad months.
- Customer Churn Rate: This is the percentage of your existing customers who cancel their subscription each month. For the math to work, you have to express this as a decimal. So, a 5% churn rate becomes 0.05.
Once you have these two figures, the rest is just simple division. This process takes the guesswork out of growth, turning vague feelings of being "stuck" into a clear, data-backed problem you can actually solve.
A Quick Calculation Example
Let's walk through this with a fictional company. We'll call them "SyncUp," a project management tool that feels like its growth has hit a wall.
First, they dig into their metrics:
- New Customers Per Month: They've been consistently adding 120 new paying customers every month.
- Monthly Customer Churn Rate: They're losing 4% of their customer base each month.
Now, let's pop those numbers into our formula. Just remember to convert that churn rate into a decimal (4% = 0.04).
Growth Ceiling = 120 (New Customers) / 0.04 (Churn Rate)
SyncUp's Growth Ceiling = 3,000 Customers
This single number is a game-changer for the SyncUp team. It tells them that, as things stand, their business will naturally flatline at 3,000 customers. They can pour more money into marketing, but they won't break past that ceiling until they either get better at keeping customers or fundamentally change how they acquire them.
Of course, the most advanced versions of these calculators often use leading predictive analytics software to model all sorts of complex scenarios, but this basic formula is the foundation for everything.
Using a Tool to Speed Things Up
While you can do the math on a napkin, a dedicated tool helps you see the impact of changes instantly. We built our free SaaS Operations Growth Ceiling Calculator for this very reason—so you can plug in your numbers without messing with spreadsheets.
Here’s what it looks like with SyncUp’s data.
The calculator spits out their 3,000 customer ceiling in a second. This kind of instant feedback is gold for operators. It lets you play around with the numbers and immediately see how a small improvement in churn could dramatically raise your company’s potential.
This simple calculation forces a much bigger strategic conversation. For a company like SyncUp, acquiring those 120 customers every month costs real money. The logical next step is to understand if that cost is even worth it. A customer acquisition cost calculator can help you connect the dots between your spending and your true growth potential, helping you decide where your next dollar is best spent.
Using Scenarios to Analyze Your Growth Potential
Figuring out your current growth ceiling is a great start, but it's really just the first step. The true magic happens when you use a growth potential calculator as a business simulator. This is where you can start modeling different scenarios and turn a static number into a dynamic roadmap for growth.
This is the point where you shift from diagnosis to action. You get to ask powerful "what if" questions that can shape your company's entire focus. What if we could bump new customer acquisition by 20%? What if we managed to slice our churn rate in half? The answers will show you which lever—acquisition or retention—gives you the most bang for your buck.
This diagram perfectly illustrates how new customers and churn are the two opposing forces that set your growth ceiling.
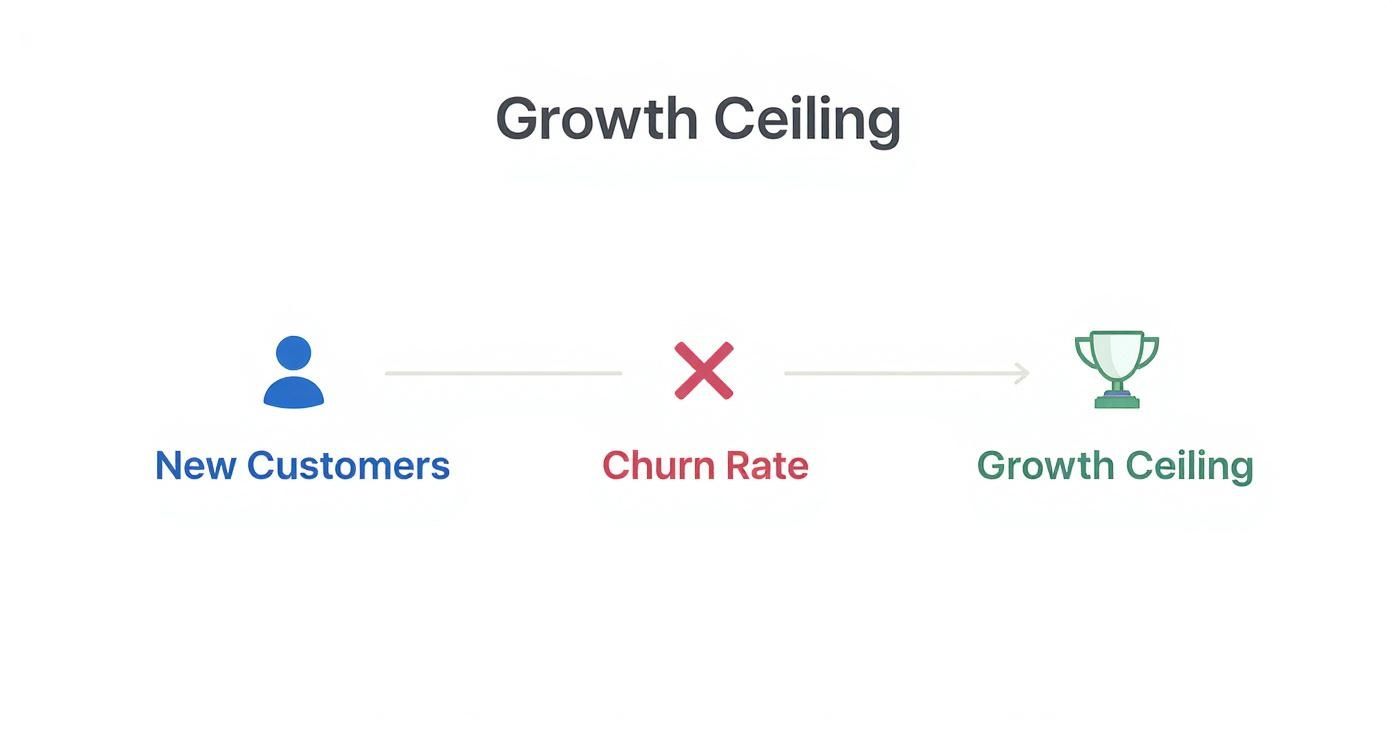
As you can see, you can't just focus on one and ignore the other. Finding the right balance is the key to sustainable, long-term growth.
Modeling Scenarios with Our Fictional SaaS
Let's jump back to our example company, SyncUp. Their baseline is 120 new customers each month and a 4% monthly churn rate, which puts their growth ceiling at 3,000 customers. Now, let's play around with the numbers and see what happens when they model a few strategic changes.
The team has two main ideas they want to explore:
- The Acquisition Push: They're confident a new marketing campaign can boost new customers by 25%, taking them from 120 to 150 per month, while churn stays put.
- The Retention Revamp: They're launching a customer success initiative aimed at cutting their churn rate in half, dropping it from 4% down to just 2%, while acquisition holds steady.
This simple exercise is all about visualizing the real-world impact of each strategy before committing a single dollar.
Comparing Potential Outcomes
Okay, let's run these numbers through the growth ceiling formula. Laying it all out in a simple table makes the results incredibly clear.
Impact of Churn and Acquisition on Growth Ceiling
Here’s a look at SyncUp's baseline compared to the potential outcomes of their two big initiatives. We're starting with their current 120 new customers and 5% churn, then modeling the changes.
| Scenario | New Customers / Month | Monthly Churn Rate | Calculated Growth Ceiling (Total Customers) |
|---|---|---|---|
| Baseline | 120 | 4.0% | 3,000 Customers |
| Acquisition Push | 150 (+25%) | 4.0% | 3,750 Customers |
| Retention Revamp | 120 | 2.0% (-50%) | 6,000 Customers |
| Combined Effort | 150 | 2.0% | 7,500 Customers |
The results are pretty staggering, right? While boosting acquisition by 25% lifts their ceiling by a respectable 750 customers, cutting their churn rate in half actually doubles their company's total potential.
This is the kind of crystal-clear insight that helps SaaS leaders decide where to put their limited time and money.
"For years, our board meetings were all about MQLs and CAC. We were acquisition-obsessed. The moment we modeled our growth ceiling, the conversation flipped. We realized a 1% reduction in churn was worth more than a 10% increase in new leads. It changed our entire company's focus overnight." – Founder, B2B SaaS
This "aha!" moment is a common turning point for so many SaaS companies. It’s the shift from a short-term, top-of-funnel mindset to a long-term strategy built for sustainable growth.
From Simulator to Strategy
For SyncUp, the scenarios make it obvious: retention is the far bigger growth lever. This single insight lets them build a focused strategy. Instead of hiring another marketer, they might decide to invest in a customer success manager or spend time building out better onboarding flows.
This kind of proactive planning is so much more effective than just reacting when growth starts to slow down. The calculator becomes a core part of your strategic toolkit, helping you simulate outcomes before you commit resources. It also helps with financial planning, as these models can feed directly into your projections. You can learn more about how to do this by exploring different revenue forecasting methods.
Using a growth potential calculator for scenario planning isn't just a math exercise; it's about building a smarter, more resilient SaaS business. It gives you the data you need to make confident decisions and get your entire team aligned around the goals that will actually move the needle.
Common Pitfalls When Calculating Your Growth Ceiling
A growth potential calculator is a fantastic tool for getting a clear-eyed view of your business, but it's not a crystal ball. The classic "garbage in, garbage out" rule applies here. A few common mistakes can easily turn your strategic compass into a source of total misdirection, leading you to chase the wrong goals and burn through cash.
One of the easiest traps to fall into is using inconsistent data. You absolutely cannot mix and match timeframes. For example, if you’re looking at your annual new customer count, you have to pair it with your annual churn rate. Using your yearly acquisition number with your monthly churn will spit out a wildly inflated—and totally useless—growth ceiling.
It's also easy to get fooled by vanity metrics. The total number of new sign-ups doesn't mean much if those users never pull out their credit cards. To get a real forecast, your calculator needs the number of net new paying customers you add each month.
Ignoring Customer Segmentation
Calculating one single, blended churn rate for your entire customer base is a massive pitfall. It’s like trying to gauge the health of an entire forest by looking at just one tree. This average number almost always hides the real story happening within specific customer groups.
Think about it. Your enterprise clients might be rock-solid, churning at just 1% per month. At the same time, your self-serve SMB customers could be leaving at a much higher 8%. The average might look like a respectable 4.5%, completely masking the fact that one part of your business is a leaky bucket.
"We thought our churn was manageable until we segmented by plan type. We discovered our lowest-tier plan had a 10% monthly churn rate. It was a revolving door that was consuming all our support resources and killing our growth potential. That insight forced us to completely rethink our pricing and onboarding." – SaaS Operator
When you don't segment, you're flying blind. You have no idea which customers need help or where your biggest opportunities for improving retention are. To really get a handle on this, check out our complete guide to understanding SaaS churn rate.
Treating the Ceiling as a Static Number
Your growth ceiling isn't a "set it and forget it" number. One SaaS operator learned this the hard way. They calculated their ceiling, built a strategy around it, and didn't revisit the number for six months. In that time, a new competitor hit the scene, their churn crept up, and their growth potential quietly dropped without them even noticing.
The market never stands still. Even something as stable as the Scientific Calculator market, which is crucial for education, has seasonal ups and downs tied to the school year. That market is projected to hit over USD 421 million by 2025, but its growth isn't a straight line; it ebbs and flows. You can see more on these trends over at wkinformation.com.
Your SaaS business is the same. Your growth potential needs to be monitored regularly. Treat it like a core KPI that you review every single month.
To keep your calculations honest and useful, build these habits into your operations:
- Data Discipline: Make sure your acquisition and churn data are always defined and measured over the exact same timeframes.
- Regular Reviews: Fold the growth ceiling calculation into your monthly or quarterly business reviews. No exceptions.
- Segment Everything: Slice your churn and acquisition data by customer persona, pricing plan, or acquisition channel. This is where the real insights are hiding.
By steering clear of these common mistakes, your growth potential calculator becomes what it’s supposed to be: a reliable guide for making smarter, more strategic decisions.
Actionable Playbooks to Raise Your Growth Ceiling
Knowing your growth ceiling is a fantastic start, but it's just a number on a spreadsheet unless you have a plan to smash right through it. Think of it this way: your calculator just showed you where the wall is. Now, you need the tools to start knocking it down.
This is where the real work begins. I'm going to walk you through two battle-tested playbooks, pulled directly from the trenches of successful SaaS companies. These aren't theories; they're step-by-step guides for turning that growth ceiling from a hard limit into your next big target.
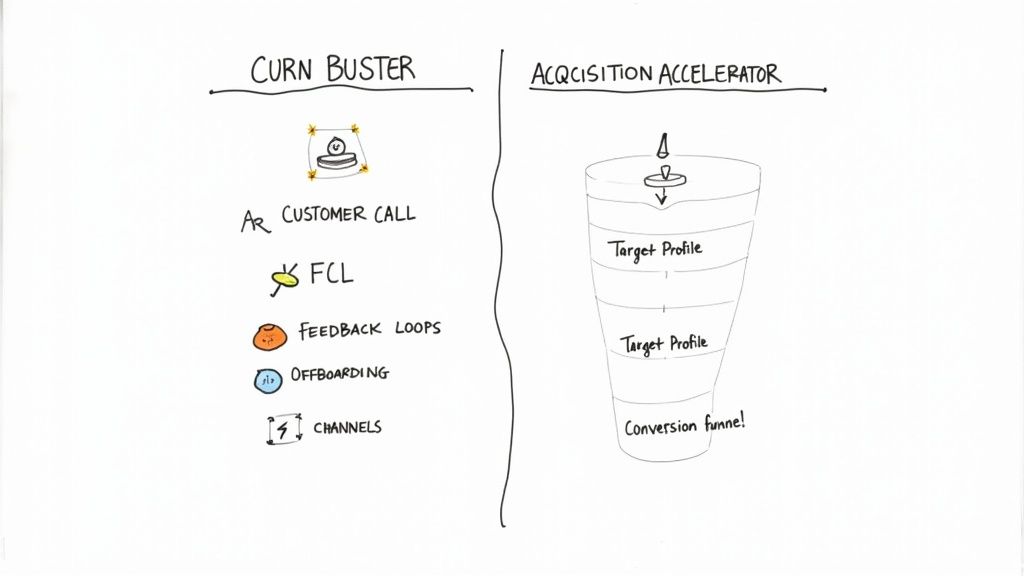
The Churn Buster Playbook
Let's start with the biggest lever you can pull: churn. It’s the silent killer of growth. This playbook is all about systematically plugging the leaks in your customer base by creating an experience that constantly proves your value.
The goal here isn't just a last-ditch effort to save a customer who's already one foot out the door. It's about building a proactive retention engine.
Step 1: Create Proactive Health Score Check-ins
Don't wait for the cancellation email. You need to know who's unhappy before they do. A simple "customer health score" based on product usage is your early warning system. Low logins? Unused key features? Red flag.
- Action: Have your customer success team run a weekly report flagging all accounts with declining health scores.
- Process: Reach out with a simple, human email. Something like, "Hey [Name], I noticed you haven't tried out [Feature X] yet. It could save you a ton of time—here’s a 1-minute video showing you how." It’s a low-effort way to show you’re paying attention and deliver value before they even think about leaving.
Step 2: Implement a Structured Feedback Loop
You absolutely have to know why people are leaving. A structured feedback loop turns every cancellation into a valuable piece of intel.
- Action: When a user hits the "cancel" button, show them a simple, one-question survey: "What's the main reason you're leaving?" Use multiple-choice options to make it quick and easy to analyze the data.
- Process: Tally up these responses every single month. If you see that 30% of churning customers are all pointing to "missing feature Y," you’ve just gotten a crystal-clear signal for your product roadmap.
Step 3: Design a Data-Driven Offboarding Process
For the customers you just can't save, your mission is to learn everything you can. This is your last chance to gather priceless insights.
- Action: Offer a brief, optional exit interview with a customer success manager. A small gift card or a final free month of service is a great incentive.
- Process: In that call, dig deeper than the survey. Ask the real questions: "What tool are you switching to?" and "What was the final straw that made you decide to leave?" This qualitative data is pure gold.
The Acquisition Accelerator Playbook
While you’re busy plugging the leaks, you've still got to keep the pipeline full. This playbook is about cranking up your new customer rate by working smarter, not just throwing more money at ads. It's about finding what works and pouring fuel on that fire.
The core idea is to ruthlessly identify your best acquisition channels and focus your resources there. To really get aggressive, you might want to look into growth hacking strategies, which are all about rapid, data-driven experimentation.
Step 1: Identify and Double Down on Your Top Channel
Let’s be honest: not all of your marketing channels are created equal. You need to find the one that brings you the best customers and go all-in.
- Action: Run the numbers. Analyze the lifetime value (LTV) of customers from each of your channels—SEO, paid ads, referrals, you name it.
- Process: Let's say you find that customers from organic search have a 50% higher LTV than those from paid ads. The move is obvious: reallocate a chunk of that ad spend into content and SEO to get more of those high-value users.
Step 2: Refine Your Ideal Customer Profile (ICP)
Your absolute best customers—the ones who stick around and love your product—share common DNA. Nailing down that ICP lets you aim your marketing with a sniper rifle instead of a shotgun.
- Action: Go talk to your top 10% of customers (by LTV or engagement). Find the patterns. What industry are they in? How big is their company? What specific problem is your tool solving for them?
- Process: Take those insights and rewrite your website copy, ad targeting, and content to speak directly to that person. You'll not only boost conversion rates but also lower churn because you’re attracting the right people from the very beginning.
These guides are a solid starting point. For a more exhaustive collection, check out our full library of SaaS playbooks built to help you systematize every part of your operation.
Even in well-established markets, this principle of focused improvement is key. Take the Graphing Calculator market, for example. It was valued at USD 1.756 billion in 2024 and keeps growing simply by refining its features for specific STEM education needs. Just like those calculator companies, you have to constantly tune your product to perfectly match the needs of your ideal customers.
Frequently Asked Questions
When you first start digging into a growth potential calculator, a bunch of questions are bound to pop up. That's a good thing. Getting good answers is what stops you from making a bad assumption that sends your whole strategy off course.
Here are the most common questions we hear from SaaS operators trying to get a handle on this.
How Often Should I Calculate My SaaS Growth Potential?
Think of this calculation as one of your core KPIs—something you look at every single month. Things in SaaS move fast. A new competitor pops up, you ship a major product update, or a marketing channel suddenly takes off. Any of these can throw your acquisition and churn rates for a loop.
By tracking this monthly, you'll spot trends before they become problems. If you see your growth ceiling drop two months in a row, that's your flashing red light. It's time to dig in and figure out if you're acquiring fewer customers or losing more of the ones you have. This turns the calculator from a one-off number into a compass that guides your decisions.
What Is a Good Growth Ceiling for a SaaS Business?
Honestly, there's no magic number. "Good" is completely relative. For a startup just finding its footing, hitting a ceiling of 1,000 customers might feel like a massive win. For an established company, that same number could be a sign of a five-alarm fire.
What really matters is the gap between your current customer count and your ceiling.
A good rule of thumb: if you're already at 80-90% of your calculated ceiling, you're in the danger zone. Growth is about to get really hard. The goal is to keep that ceiling far, far above your current customer number.
That space between where you are and where you could be? That's your real runway. Your job is to keep it as long as possible.
Should I Use Customer Churn or Revenue Churn?
For the sharpest picture, you really need to look at both. Customer churn (or logo churn) is straightforward and easy to track, but revenue churn (MRR churn) often tells the more important financial story.
Imagine this: your customer churn is a tiny 2%, but your revenue churn is a painful 8%. That's a classic sign you're losing your biggest, highest-paying customers. In that world, your revenue growth ceiling is way lower than your customer ceiling, which points to some serious trouble for your bottom line.
Calculating both gives you a 360-degree view of your health—how well you keep customers and how well you keep their money.
My Acquisition Rate Varies Month to Month. What Should I Use?
Yeah, this is super common. If your new customer numbers are all over the place, don't just grab last month's data. One huge marketing win or a dead-slow holiday month can completely skew the calculation, giving you a false sense of security or a needless panic attack.
The smarter move is to use a rolling average. Just take the average number of new customers you've brought in each month over the last three or six months. This smooths out all the bumps from one-off campaigns, seasonal dips, or random market swings.
A 3-month rolling average usually gives you a much more stable and realistic look at what your acquisition engine can actually do.
Does the Growth Ceiling Relate to Market Size?
It does, but they aren't the same thing. Your Total Addressable Market (TAM) is the absolute theoretical max—what you'd get if you captured 100% of your market. Your growth ceiling is an internal report card. It shows you the max size you can hit with your current operations.
Here's an easy way to think about it:
- TAM is the entire ocean.
- Your Growth Ceiling is the size of the boat you've built.
It doesn't matter how big the ocean is if your boat is tiny and leaky. You first need to fix your internal engine (acquisition and churn) to build a bigger boat. Only then can you go after a bigger piece of that market.
What If My Churn Rate Is Negative?
First off, congratulations! Negative churn—where expansion revenue from current customers outpaces revenue lost from churners—is the dream. It’s the holy grail of SaaS.
When you hit this point, the standard growth ceiling formula kind of breaks. Theoretically, your potential is unlimited because your existing customers are now a growth engine all on their own. But don't stop tracking things! You should still keep a close eye on customer churn (logo churn) to make sure your user base is actually growing and healthy. You can still hit a ceiling on your customer count, even if your revenue keeps climbing.
Don't have all the numbers you need? Try our free Growth Ceiling Calculator to get started and see where you stand.
At SaaS Operations, we provide the proven playbooks, templates, and SOPs you need to build a more efficient and scalable business. Our frameworks are battle-tested by operators who have built multiple 8-figure SaaS companies. Stop guessing and start growing with a clear operational strategy. Get the tools you need at https://saasoperations.com.