10 Key Business Process Mapping Techniques for SaaS in 2025
In the fast-paced world of SaaS, efficiency isn't just a goal—it's a survival mechanism. Unseen bottlenecks, redundant tasks, and unclear responsibilities can quietly drain resources and slow growth. This is where business process mapping becomes your operational superpower. It's not about creating complex charts that gather dust; it's about gaining a crystal-clear view of how work actually gets done in your organization.
From customer onboarding to feature deployment, understanding your workflows is the first step to optimizing them. But with so many methods available, which is the right one for your specific challenge? Selecting the wrong technique can be as inefficient as having no map at all. For a comprehensive understanding of various process mapping methodologies, including practical applications, you might also find value in this guide to 10 Key Business Process Mapping Techniques.
This guide cuts through the noise. We will present 10 distinct business process mapping techniques, each tailored for the unique challenges and opportunities within a SaaS business. We'll explore each method's strengths, ideal use cases, and practical implementation steps. Our goal is to give you the clarity needed to select the perfect tool to build a more efficient, scalable, and profitable operation.
1. Flowchart Process Mapping
Flowcharting is one of the most fundamental and widely-used business process mapping techniques. It provides a clear, visual representation of a process from start to finish using standardized symbols. Each shape signifies a different type of action or decision, like rectangles for process steps and diamonds for decision points, all connected by arrows that show the directional flow.

For a SaaS company, this technique is perfect for outlining linear, sequential workflows. Consider mapping a customer trial-to-paid conversion process. A flowchart can clearly illustrate the automated email sequences, the touchpoints for sales intervention, and the logic for handling different user responses, ensuring no potential customer slips through the cracks. This visual clarity helps identify bottlenecks and opportunities for automation.
When to Use This Technique
This method is ideal for processes that are straightforward, have clear start and end points, and involve a limited number of decision paths. It excels at training new employees, standardizing existing procedures, and identifying redundancies in your core operations.
Pro Tip: Start by mapping the "happy path" (the ideal process flow) first. Then, add branches for exceptions, errors, and alternative outcomes to create a comprehensive and realistic map.
Actionable Implementation Tips
- Standardize Symbols: Use a consistent set of symbols (like BPMN or basic flowchart shapes) so everyone on your team interprets the map correctly.
- Keep Text Concise: Label each step with a clear, action-oriented phrase, such as "Send Welcome Email" instead of a long description.
- Collaborate: Build the flowchart with team members who actually perform the process to ensure accuracy and buy-in.
By creating this visual guide, you establish a solid foundation for more complex operational improvements. You can explore a deeper dive into how this fits into a broader strategy by learning more about SaaS operations management.
2. Swimlane Diagrams (Cross-Functional Flowcharts)
Swimlane diagrams are a powerful type of flowchart that clarifies not just what happens in a process, but who is responsible for each step. This business process mapping technique divides a diagram into parallel "lanes," with each lane representing a different department, role, or even a system. By visually separating tasks this way, it becomes immediately clear where handoffs occur and how work moves between different functional groups.

For a SaaS company, a swimlane diagram is perfect for mapping a new feature release process. It can show how the product team defines requirements, the engineering team builds the feature, the QA team tests it, and the marketing team prepares the launch campaign. This clarity is crucial for preventing communication breakdowns and ensuring smooth collaboration between teams that often operate in silos.
When to Use This Technique
This method is essential for any process that crosses departmental or functional boundaries. Use it to diagnose communication gaps, clarify roles and responsibilities, and identify delays caused by inefficient handoffs between teams. It's particularly effective for analyzing complex workflows like customer onboarding, bug resolution, or enterprise sales cycles.
Pro Tip: Focus the diagram on the major handoffs and points of interaction between lanes. Trying to map every minor task can make the diagram overly complex and obscure the most critical insights.
Actionable Implementation Tips
- Clearly Define Lanes: Label each lane with a specific role or department (e.g., "Sales," "Customer Support," "Billing System") to eliminate ambiguity.
- Map Horizontally: Keep the process flow moving from left to right, and place steps within the lane of the person or group responsible for that action.
- Validate with Stakeholders: Review the completed diagram with representatives from each lane to confirm accuracy and ensure everyone agrees on the process flow and their role in it.
By highlighting cross-functional dependencies, swimlane diagrams provide the insight needed to streamline collaboration and improve overall process efficiency.
3. Value Stream Mapping (VSM)
Value Stream Mapping (VSM) is a powerful lean business process mapping technique that visualizes the flow of information and materials needed to deliver a product or service to a customer. Originating from manufacturing, VSM is highly effective for identifying and eliminating waste, defined as any activity that consumes resources but adds no value from the customer's perspective. It creates a "current state" map and a "future state" map to guide improvements.
For a SaaS company, VSM can be used to analyze the entire customer journey, from initial marketing contact to onboarding and support. By mapping this process, you can identify delays in customer support responses, inefficient steps in the sales cycle, or unnecessary features in the onboarding flow. This focus on value helps streamline operations and enhance the customer experience, directly impacting retention and growth.
This infographic highlights the key metrics VSM focuses on tracking to pinpoint process inefficiencies.
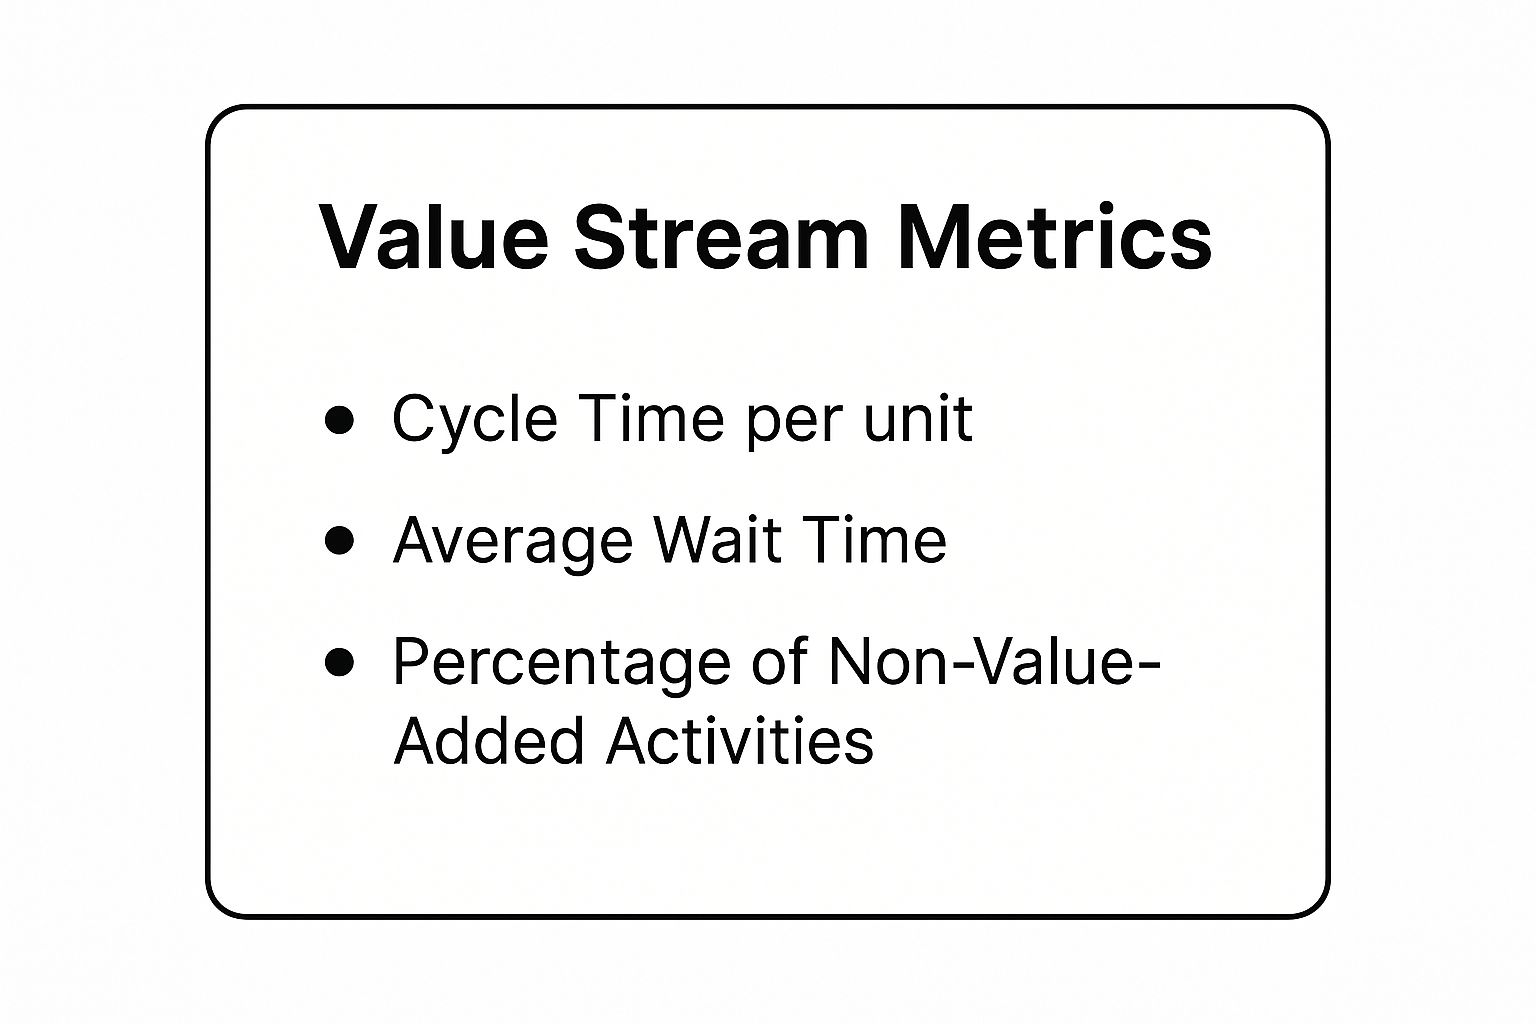
Tracking these metrics allows you to quantify waste and measure the real-world impact of your process improvements.
When to Use This Technique
This method is best when your goal is to make a process leaner, faster, and more customer-centric. Use VSM when you need to understand the big picture of your value delivery system, identify significant sources of waste (like waiting, rework, or over-processing), and align your team around targeted, high-impact improvements.
Pro Tip: Always map the process by physically or virtually "walking" it. Follow the path a customer or a piece of work takes. This firsthand observation will reveal issues that are invisible on paper.
Actionable Implementation Tips
- Define Value: Start by clearly defining what the customer values. Any step that doesn't contribute to that is a candidate for elimination.
- Collect Real Data: Don't guess. Measure actual cycle times, wait times, and error rates to ensure your map reflects reality.
- Focus on the Flow: Map the entire end-to-end stream, not just isolated departments. The biggest opportunities for improvement often lie in the handoffs between teams.
4. Business Process Model and Notation (BPMN)
Business Process Model and Notation (BPMN) is a globally recognized standard and one of the most rigorous business process mapping techniques. It offers a standardized graphical language with specific symbols and rules, creating a universal dialect that bridges the gap between business stakeholders and technical implementation teams. Unlike a basic flowchart, a BPMN diagram is detailed enough to be executed by a process engine.
For a SaaS company, BPMN is invaluable for mapping complex, multi-departmental workflows like enterprise customer onboarding. You can use "pools" and "lanes" to clearly define the responsibilities of Sales, Customer Success, and Technical Support. This visual precision ensures that handoffs are seamless and that intricate processes, like custom integrations or data migrations, are executed flawlessly, which is critical for retaining high-value clients.
When to Use This Technique
BPMN is the best choice for complex, cross-functional processes that require a high degree of precision and are intended for automation. It’s ideal for projects involving business process management (BPM) software, where the map needs to be understood by both business analysts and developers who will build the automated solution.
Pro Tip: Don't get overwhelmed by the extensive BPMN symbol set. Start with the basic elements: events (circles), activities (rectangles), and gateways (diamonds). Master these before incorporating more advanced symbols for exceptions and compensations.
Actionable Implementation Tips
- Use Pools and Lanes: Clearly separate process participants (e.g., departments, systems) to visualize handoffs and define responsibilities.
- Focus on Business Logic First: Before diving into technical details, ensure the process flow accurately reflects the business requirements and logic.
- Validate with All Stakeholders: Review the BPMN diagram with both the business team (for accuracy) and the IT team (for feasibility) to ensure everyone is aligned.
This standardized approach not only clarifies your current operations but also provides a technical blueprint for future automation. You can learn more about the formal specification from the Object Management Group (OMG).
5. SIPOC Diagram (Suppliers, Inputs, Process, Outputs, Customers)
A SIPOC diagram is a high-level business process mapping technique that captures a process's most essential elements in a simple, one-page format. Popularized by Six Sigma, it provides a macro-level view by identifying the Suppliers, the Inputs they provide, the core Process steps, the Outputs produced, and the Customers who receive them.
For a SaaS company, a SIPOC diagram is excellent for defining the scope of a complex project before diving into details. Imagine mapping the customer support ticket resolution process. The suppliers might be customers and internal monitoring tools. Inputs would be support tickets and system alerts. The high-level process is "Log, Triage, Resolve, and Close Ticket." Outputs are resolved tickets and satisfaction surveys, and customers are the end-users who receive the resolution.
When to Use This Technique
This method is perfect for the initial stages of a process improvement project when you need to get everyone aligned on the scope and boundaries of the process. It helps define complex projects and ensures all stakeholders understand who and what is involved before committing to a deep-dive analysis.
Pro Tip: Use the SIPOC diagram as a project charter or a conversation starter. It’s a powerful tool to quickly get a team on the same page and define the start and end points of the process you're analyzing.
Actionable Implementation Tips
- Keep it High-Level: Limit the process block to just 5-7 high-level steps. The goal is a summary, not a detailed flowchart.
- Identify All Stakeholders: Be sure to include both internal and external suppliers and customers to get a complete picture of the process ecosystem.
- Validate with the Team: Share the completed diagram with the people who perform the work to confirm its accuracy and ensure nothing critical was missed.
6. Unified Modeling Language (UML) Activity Diagrams
Unified Modeling Language (UML) Activity Diagrams are a powerful, more technical approach to business process mapping techniques. Originating from software engineering, they use a standardized set of symbols to model the flow of activities, actions, and decisions within a system or business process. These diagrams excel at visualizing complex workflows, including parallel processing and conditional logic.
For a SaaS company developing a new feature, a UML activity diagram can map the entire software development lifecycle. It can detail everything from initial requirement gathering and user story creation to coding, testing, and deployment, clearly showing how different activities and team handoffs occur. This level of detail is critical for coordinating complex engineering projects and ensuring system integrations function as intended.
When to Use This Technique
This method is best suited for mapping processes that are technical, involve multiple systems, or have complex control flows like concurrent activities. It's ideal for system analysis, software development planning, and detailing data processing workflows where precision and clarity on a technical level are paramount.
Pro Tip: Use swimlanes (partitions in the diagram) to clearly assign responsibility for each activity to a specific role, department, or system. This visual separation instantly clarifies who does what.
Actionable Implementation Tips
- Focus on Business Logic: Keep the diagram centered on business-relevant activities and outcomes rather than getting lost in overly granular technical implementation details.
- Maintain Abstraction: Create high-level diagrams for executive overviews and more detailed diagrams for implementation teams to keep the map relevant for its audience.
- Provide Training: Since UML is a formal notation, ensure non-technical stakeholders receive a brief orientation on how to read the diagrams to facilitate cross-functional collaboration.
By using UML, you can create unambiguous models of your most complex operations. For those looking to streamline the creation of these diagrams from existing codebases, exploring options like using Code to UML Diagram Generators can significantly speed up the documentation process.
7. Detailed Process Maps
Detailed Process Maps offer a granular, comprehensive view of a workflow, capturing every single step, decision, input, and output. Unlike higher-level diagrams, these maps document specifics like timing, roles, systems used, and key metrics, serving as an exhaustive guide to how a process functions.
For a SaaS company in a highly regulated industry like FinTech or HealthTech, this is an essential business process mapping technique. Imagine mapping the process for handling sensitive patient data. A detailed map would specify each encryption step, the exact roles with access permissions, the specific compliance checks (like HIPAA), and the systems used, leaving no room for error or ambiguity.
When to Use This Technique
This method is critical for complex, high-risk, or regulated processes where precision is non-negotiable. It is the gold standard for compliance audits, in-depth process analysis, business process reengineering, and creating comprehensive training materials for critical roles.
Pro Tip: Don't try to create a detailed map for every single process. Prioritize high-impact, high-risk, or frequently failing workflows first to get the most value from the significant time investment required.
Actionable Implementation Tips
- Balance Detail and Usability: Include all necessary information without making the map so dense it becomes unreadable. Use appendices or linked documents for supplementary details.
- Use Visual Aids: Incorporate screenshots, icons, and color-coding to make the map easier to navigate and understand, especially when referencing specific UI elements in your software.
- Establish a Review Cycle: Processes change. Schedule regular reviews (e.g., quarterly or annually) to ensure the documentation remains accurate and relevant.
By meticulously documenting your core operations, you create a single source of truth that is invaluable for scaling and compliance. You can learn more about how to effectively create these guides by exploring best practices for business process documentation.
8. Process Flow Analysis (PFA)
Process Flow Analysis (PFA) is a quantitative and analytical business process mapping technique focused on the flow of work, information, or materials. Rather than just visualizing steps, PFA uses data to analyze flow rates, capacity, and bottlenecks, providing a mathematical basis for identifying performance gaps and driving efficiency improvements.
For a SaaS company, PFA is invaluable for optimizing high-volume, data-rich processes. Consider a customer support ticketing system. By analyzing ticket arrival rates, resolution times, and agent capacity, you can pinpoint constraints causing backlogs. This data-driven approach allows you to reallocate resources or automate specific ticket types to dramatically improve response times and customer satisfaction.
When to Use This Technique
This method is best when you need to move beyond a simple visual map and make data-backed decisions to optimize a process. It’s ideal for analyzing systems with high variability, such as call center operations, software development sprints, or supply chain logistics, where performance metrics are critical.
Pro Tip: Focus your initial analysis on the primary constraint or bottleneck in the process. Improving a non-bottleneck step won't improve the overall system's output, so identifying and addressing the biggest limiter yields the greatest impact.
Actionable Implementation Tips
- Collect Accurate Data: Use system logs, time-tracking tools, and operational reports to gather precise data on volumes, cycle times, and wait times.
- Identify Constraints: Use your analysis to find the single step or resource that limits the entire process's throughput (the "bottleneck").
- Validate Findings: Compare the results of your analysis with real-world operational data to ensure your model accurately reflects reality.
Using PFA helps you quantify the gap between your current and desired performance. You can apply a similar analytical mindset by learning more about how to perform a gap analysis in other business areas.
9. Hierarchical Process Mapping
Hierarchical Process Mapping is a structured business process mapping technique that organizes complexity by breaking down large processes into multiple, digestible levels. It starts with a high-level, end-to-end view and allows you to drill down into increasingly detailed sub-process maps, creating a linked family of diagrams. Each level provides more granularity than the one above it.
This method is invaluable for a SaaS company mapping its entire enterprise architecture, from customer acquisition to churn management. For example, a top-level map might show "Onboard New Customer." Clicking on that step would reveal a more detailed sub-process map showing "Create Account," "Send Welcome Series," and "Schedule Kickoff Call." This layered approach ensures that stakeholders can engage with the process at the level of detail most relevant to them.
When to Use This Technique
This approach is best suited for documenting large-scale, complex, or enterprise-wide processes that are too intricate for a single diagram. It excels at creating a comprehensive process library, aligning cross-functional teams on how their individual tasks contribute to the bigger picture, and managing large-scale operational change.
Pro Tip: Define clear and consistent criteria for what constitutes each level (e.g., Level 1 is the value chain, Level 2 is the core process, Level 3 is the detailed workflow). This creates a logical and easy-to-navigate process architecture.
Actionable Implementation Tips
- Establish Clear Ownership: Assign a specific owner to each process and sub-process level to ensure accountability and maintenance.
- Use Consistent Notation: Apply the same symbols and formatting across all levels of your maps to avoid confusion and maintain a professional standard.
- Create Navigation Aids: Use hyperlinks or clear cross-references within your mapping tool to make it easy for users to move between different levels of detail.
By creating this structured overview, you can track performance at both a macro and micro level. This can be enhanced by learning more about how a scorecard format in Excel can measure the KPIs for each process level.
10. Digital Process Modeling and Simulation
Digital Process Modeling and Simulation takes traditional mapping a step further. It is an advanced business process mapping technique that uses specialized software to create dynamic, interactive models of your workflows. These models aren't static; they can be run through simulations to test different scenarios, predict performance under various conditions, and identify optimal process designs before implementation.
For a SaaS company, this is invaluable for scaling operations. You could simulate how your customer support ticketing system will handle a 300% increase in volume after a major product launch. The simulation could predict agent workload, response times, and potential bottlenecks, allowing you to proactively adjust staffing and workflows instead of reacting to a crisis.
When to Use This Technique
This method is best suited for complex, high-stakes processes where the cost of failure is high or where small efficiency gains can have a massive impact. It’s perfect for stress-testing infrastructure, planning for scalability, optimizing resource allocation, and validating changes before they go live.
Pro Tip: Don’t aim for a perfect, all-encompassing model on your first try. Start by simulating a single, critical process and validate its results against real-world data before expanding its complexity.
Actionable Implementation Tips
- Ensure Data Accuracy: Your simulation is only as good as the data you feed it. Use accurate, representative data for process times, resource availability, and arrival rates.
- Validate Your Model: Before making decisions, run the simulation with historical data and compare its output to actual past performance to ensure the model is reliable.
- Focus on Actionable Insights: The goal isn’t to build the most sophisticated model, but to gain insights that lead to better decisions and process improvements.
By simulating outcomes, you can make data-driven decisions that are core to effective scaling. This technique often serves as a precursor for identifying opportunities where you can learn more about workflow automation.
Business Process Mapping Techniques Comparison
| Process Mapping Technique | Implementation Complexity 🔄 | Resource Requirements ⚡ | Expected Outcomes 📊 | Ideal Use Cases 💡 | Key Advantages ⭐ |
|---|---|---|---|---|---|
| Flowchart Process Mapping | Low – simple symbols and linear flow | Low – basic tools, minimal data | Clear visual of sequential steps | Simple to moderately complex sequential processes, training | Intuitive, quick creation, widely supported |
| Swimlane Diagrams | Medium – requires defining lanes and actors | Medium – may need larger formats or digital tools | Identifies responsibilities and handoffs | Cross-departmental processes, accountability analysis | Clarifies ownership, improves interdepartmental communication |
| Value Stream Mapping (VSM) | High – detailed data collection, specific symbols | High – time/motion study, specialized training | Identifies waste, improves flow efficiency | Manufacturing, supply chain optimization, lean initiatives | Quantitative, waste-focused, supports continuous improvement |
| Business Process Model and Notation (BPMN) | High – complex notation and standards | High – specialized software and training | Detailed, executable process models | Complex business processes, process automation, enterprise-wide | Standardized, supports automation, bridges business-IT gap |
| SIPOC Diagram | Low – simple table format, high-level overview | Low – minimal data and tools | Defines process scope and key stakeholders | Process definition, project scoping, initial analysis | Quick, easy to understand, aligns teams early |
| UML Activity Diagrams | High – UML knowledge required, technical detail | Medium to High – modeling tools, training | Precise workflow with parallel and conditional logic | Technical processes, software workflows, complex logic | Handles concurrency, strong for software documentation |
| Detailed Process Maps | High – very granular and comprehensive documentation | High – time-consuming, detailed data gathering | Thorough understanding, compliance, training | Training, compliance, complex process analysis | Complete detail, supports root cause analysis |
| Process Flow Analysis (PFA) | High – quantitative modeling and statistical analysis | High – data collection, analysis software, expertise | Identifies bottlenecks, optimizes capacity | Capacity planning, bottleneck identification, resource allocation | Data-driven insights, enables simulation |
| Hierarchical Process Mapping | Medium to High – multi-level maps and structured decomposition | Medium – planning and coordination needed | Manages complexity with scalable documentation | Large organizations, complex environments, governance | Scales well, serves diverse stakeholder needs |
| Digital Process Modeling and Simulation | Very High – advanced simulation software and modeling | Very High – specialized software, computational resources | Predictive insights, process optimization | Complex process optimization, digital transformation initiatives | Dynamic analysis, scenario testing, continuous improvement |
From Maps to Momentum: Putting Your Processes to Work
You've explored the diverse landscape of business process mapping techniques, from the straightforward clarity of a basic Flowchart to the comprehensive detail of BPMN. We've navigated through Swimlane Diagrams that clarify team responsibilities, Value Stream Maps that hunt down waste, and SIPOC diagrams that provide a high-level overview of any complex operation. Each method offers a unique lens through which to view your SaaS company's inner workings.
But the most beautifully crafted process map is only a starting point. Its true power isn't in the diagram itself, but in the action it inspires. A map is a tool for diagnosis, not the cure. The real transformation begins when you translate these visual insights into tangible, operational improvements.
From Insight to Implementation
The journey from a process map to enhanced performance involves a few critical steps. Don't let your hard work gather dust in a shared drive. Instead, use your maps as living documents that guide strategic action.
- Prioritize Opportunities: Your maps will likely reveal multiple areas for improvement. Use techniques like Value Stream Mapping to identify the changes that will have the most significant impact on customer value and efficiency. Focus on fixing the biggest bottlenecks first.
- Communicate and Align: Share your findings across teams. A Swimlane Diagram, for instance, is an excellent tool for clarifying cross-functional handoffs and setting clear expectations. Use these visuals to get everyone aligned on the "why" behind upcoming changes.
- Develop an Action Plan: For each identified improvement, create a clear plan. Assign ownership, set timelines, and define what success looks like. This is where you move from theory to execution.
Ultimately, the practical application of process maps is to guide your organization on how to improve operational efficiency, transforming theoretical diagrams into tangible results.
Building a Culture of Continuous Improvement
Mastering these business process mapping techniques is more than just an exercise in creating diagrams. It's about embedding a mindset of continuous improvement into your company's DNA. When you consistently map, analyze, and refine your core processes, you build a resilient and agile organization.
This proactive approach allows your SaaS business to scale smoothly, onboard new team members faster, and adapt quickly to market changes. Your processes stop being a source of friction and instead become a competitive advantage, a well-oiled machine that supports sustainable growth. The clarity gained from mapping empowers your team to work smarter, not just harder, building the momentum needed to achieve your most ambitious goals.
Ready to turn your process maps into powerful, scalable systems? At SaaS Operations, we provide the proven playbooks, templates, and SOPs designed to help you implement changes quickly and effectively. Stop reinventing the wheel and start building a world-class operational foundation today with SaaS Operations.