Think of a pilot’s cockpit. It’s not cluttered with hundreds of blinking lights, but just a few core dials showing if you’re on course to your destination. That’s exactly what a business intelligence scorecard is for your company. It’s a simple, strategic tool designed to answer one critical question: “Are we winning?”
Understanding Business Intelligence Scorecards

A BI scorecard gives you a high-level, at-a-glance view of your company’s health, measured squarely against its most important strategic goals. It deliberately avoids getting bogged down in the weeds of real-time, granular data. Instead, it keeps everyone focused on the big picture.
Let’s stick with the pilot analogy. An operational dashboard shows you the ‘how’—things like engine RPM or oil pressure. It’s tactical and built for the immediate moment. A scorecard, on the other hand, zeroes in on the strategic ‘if’—as in, “Are we reaching our target altitude, and are we on schedule to land at our destination?”
Scorecards vs. Dashboards
It’s easy to mix up scorecards and dashboards, but understanding the difference is crucial. While they are both visual tools that display data, their purpose and who they’re for are fundamentally different. Confusing the two is a common misstep that can seriously dilute your strategic focus.
To make this crystal clear, here’s a quick breakdown of how they stack up against each other.
Scorecard vs. Dashboard at a Glance
| Attribute | Business Intelligence Scorecard | Operational Dashboard |
|---|---|---|
| Primary Goal | Monitor progress against strategic goals | Monitor operational processes in real time |
| Time Horizon | Long-term (monthly, quarterly, yearly) | Short-term (real-time, daily) |
| Data Focus | High-level summary metrics | Granular, detailed data |
| Typical User | Executives, leadership teams | Front-line managers, operational staff |
| Key Question | “Are we winning?” (Strategic) | “What’s happening now?” (Tactical) |
As the table shows, one is for steering the ship, and the other is for managing the engine room. Both are valuable, but they serve very different functions.
A defining feature of a BI scorecard is its simple, powerful visual language—often a red-yellow-green system. This instantly tells the story of your performance to anyone in the organization, from the C-suite to individual teams, no data science degree required.
- Red: Performance is way off target. This needs immediate attention.
- Yellow: A warning sign. Performance is lagging, and we need to keep an eye on it.
- Green: All good. We’re on track or even ahead of our goal.
This simple color-coding translates complex data into a clear story about strategic progress. Instead of digging through messy spreadsheets, a leader can see exactly where the business is succeeding and where it needs help. If you want to get a feel for this, you can even start by building a basic scorecard format in Excel before committing to more advanced BI tools.
A business intelligence scorecard serves as the ultimate accountability tool. It aligns every department and individual around a single version of the truth, ensuring that daily actions directly contribute to long-term strategic objectives.
The Strategic Advantage
Ultimately, the power of a BI scorecard is in how it connects your high-level strategy to day-to-day execution. It gives you a comprehensive overview of your digital marketing performance metrics and other critical business areas, making it a vital tool for any SaaS operator who’s serious about growth.
The value isn’t just theoretical. The data shows that companies with CEOs who make decisions backed by scorecard-style insights are 77% more likely to outperform their competitors. It’s no surprise that cloud-based BI solutions, which often have powerful scorecard features, are the fastest-growing part of the market. They provide the flexibility and integration that modern businesses demand.
This clear link between strategic monitoring and real-world success is precisely why scorecards are an indispensable tool for any growth-focused SaaS company.
The Building Blocks of an Effective Scorecard
To build a BI scorecard that actually works, you need to start with a solid foundation. Think of it like building a house; you wouldn’t just throw some walls up and hope for the best. A truly useful scorecard isn’t a random jumble of metrics. It’s a carefully designed framework that connects your big-picture company goals to the day-to-day work your team is doing.
This framework is built on four core pillars. When you get them right, they create a clear path from your vision all the way down to execution, making sure every ounce of effort is aligned and measurable.
The Four Pillars of a Scorecard
These four components fit together in a hierarchy, with each level adding more detail and context to the one before it.
Perspectives: These are the high-level lenses you use to look at your business. They force you to examine performance from multiple angles, helping you avoid the tunnel vision that comes from only staring at financial reports. Classic perspectives are Financial, Customer, Internal Processes, and Learning & Growth. For a SaaS company, you might find it more practical to use Customer, Product, Marketing, and Team.
Objectives: Within each perspective, you set your big-picture goals. An objective is a simple, clear statement about what you’re trying to achieve—it’s a destination, not a number. For instance, under the “Customer” perspective, a key objective might be to “Increase Customer Loyalty.”
Measures: This is where the data comes into play. For every objective, you need specific metrics that tell you whether you’re winning or losing. A crucial step here involves carefully defining your Key Performance Indicators (KPIs) to track your progress accurately. These are your hard numbers for success.
Initiatives: So, what are you actually going to do to move the needle on those measures? Initiatives are the specific projects or programs you’ll run to hit your objectives. They are the “how” that drives the results you see on your scorecard.
A great BI scorecard tells a complete story. It doesn’t just show you a number; it explains what that number means for your strategy (Objective), why it matters (Perspective), and what you’re doing about it (Initiative).
A Practical SaaS Example
Let’s bring this down to earth. Imagine a B2B SaaS company that wants to move upmarket and land bigger, more stable enterprise accounts. Their strategy is all about improving customer retention to prove their platform delivers long-term value.
Here’s how they could map out a piece of their BI scorecard:
- Perspective: Customer
- Objective: Increase Customer Retention
- Measures (KPIs):
- Net Revenue Retention (NRR): Target > 110%
- Monthly Churn Rate: Target < 1.5%
- Net Promoter Score (NPS): Target > 50
- Initiative: Implement a Proactive Onboarding Program for Enterprise Clients
This structure creates a powerful, undeniable link. The team isn’t just launching a new onboarding program because it feels like a good idea. They are doing it specifically to improve NRR, cut churn, and raise their NPS—all of which directly serve the strategic objective of increasing retention.
When you see these connections laid out on a single scorecard, it aligns the entire organization. For more ideas, you can check out these balanced business scorecard examples for SaaS success and see how other companies put this framework into action.
This infographic shows a simplified look at how key metrics roll up under a central BI scorecard.
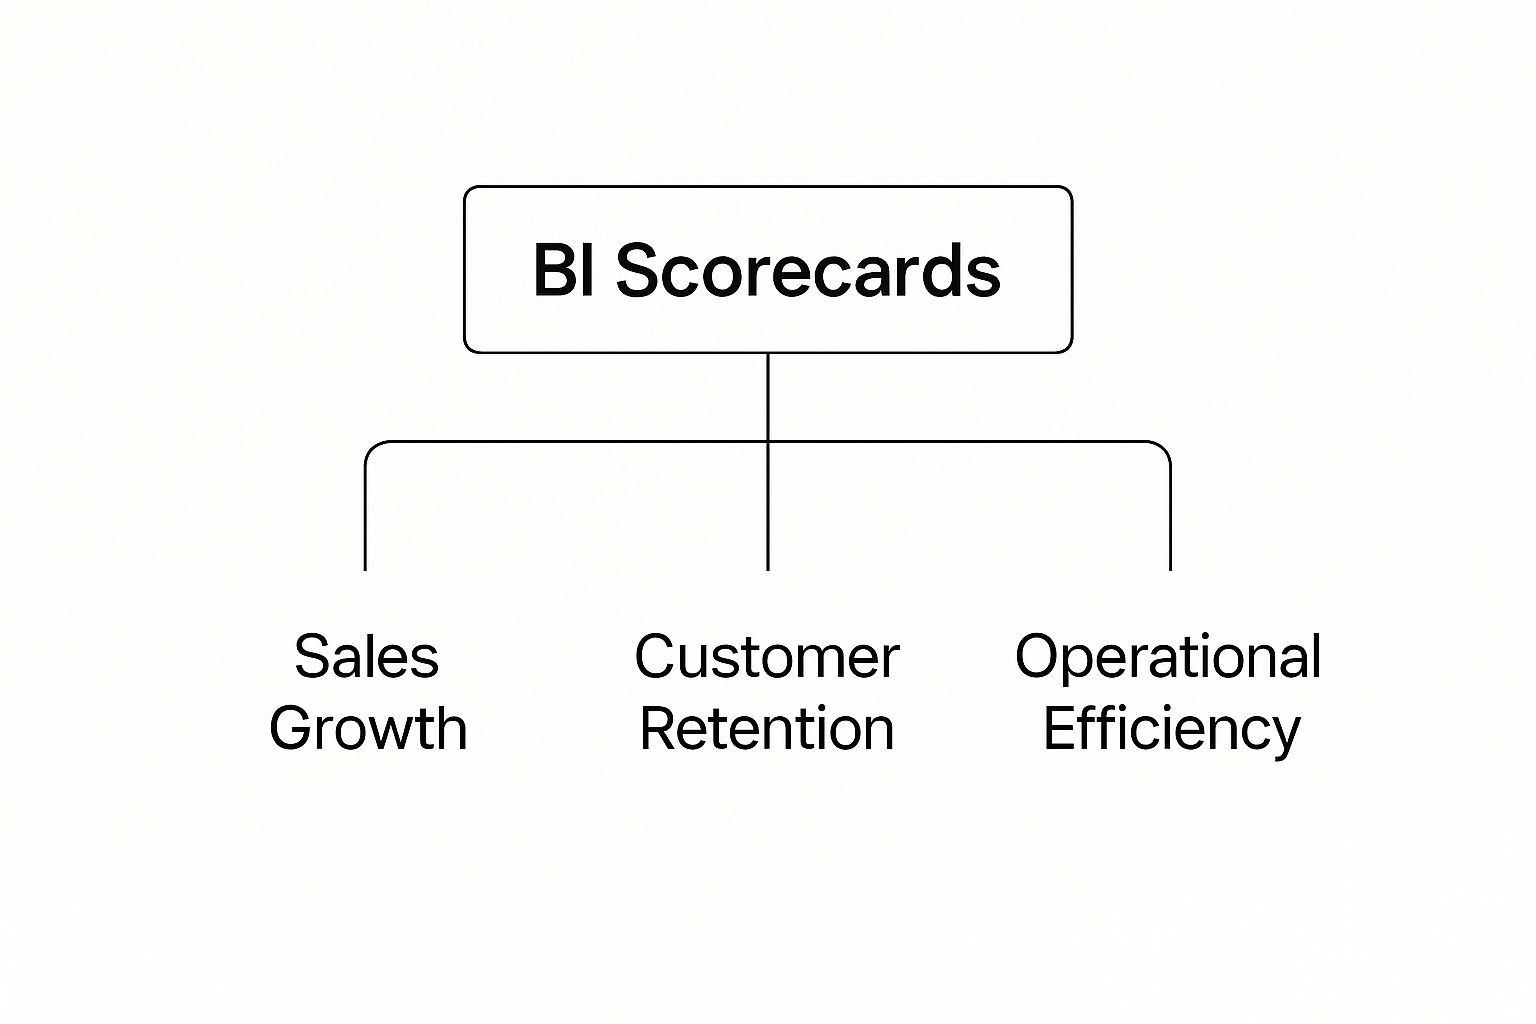
As the visual shows, top-level business goals are held up by distinct, measurable areas of performance. Once you master these building blocks, you stop just reporting on data and start strategically managing your business with real clarity and purpose.
How Scorecards Drive SaaS Growth

It’s one thing to talk about business intelligence scorecards in theory, but where they really shine is in the real world—especially for a SaaS company. In a business where every dollar of Monthly Recurring Revenue (MRR) is fought for, scorecards are the bridge connecting your high-level strategy directly to your bottom line. They shift your team from operating on gut feelings to making decisions with cold, hard data.
For a SaaS business, this means getting every department—from marketing and sales to product and customer success—pointed in the same direction. Instead of teams working from their own separate reports and chasing different goals, a scorecard creates a single source of truth. It’s a common language everyone can understand and rally behind.
This shared view smashes the data silos that so often hold back growing companies. No more meetings spent arguing over whose numbers are “right.” When the entire organization works from the same scorecard, conversations change. You stop debating the data and start strategizing on how to improve it.
Fostering a Culture of Accountability
One of the biggest wins from implementing a BI scorecard is the cultural shift it creates. When performance is out in the open and tied to clear company goals, everyone knows who owns what. Data, not opinions, starts to call the shots.
This empowers your teams. They can see exactly how their day-to-day work moves the needle on the company’s biggest goals, which makes their contributions feel more meaningful and their efforts more focused. This kind of alignment is a cornerstone of many proven SaaS growth strategies because it gets the whole company pulling together.
A business intelligence scorecard is like a contract between leadership and the teams. Leadership defines what “winning” looks like, and teams get the data and freedom they need to figure out how to get there.
Real-World Scenarios in SaaS
Let’s look at how this plays out with a couple of common SaaS situations. These examples show how a simple scorecard can trigger smart, timely decisions that save money and drive growth.
Example 1: Pivoting a Failing Marketing Campaign
Imagine a B2B SaaS startup launches a new LinkedIn campaign, spending $10,000 a month. At first, the marketing dashboard looks great—lots of clicks and impressions. The team is ready to celebrate.
But their scorecard tells a different story. The main goal is “Acquire High-Quality Leads,” measured by KPIs like Marketing Qualified Leads (MQLs) and Cost Per Acquisition (CPA). The scorecard shows these metrics in bright red. Despite all the clicks, the leads are poor quality and the CPA is 3x the target.
Because the scorecard flagged this early, they pivot after just one month, moving the budget to a better-performing channel. This quick, data-driven move saved them tens of thousands in wasted ad spend.
Example 2: Scaling a Customer Success Team
A growing SaaS company needs to figure out when to hire more Customer Success Managers (CSMs). Instead of just guessing, they tie the decision to their scorecard.
- Objective: Maintain High Customer Satisfaction
- KPI: Accounts per CSM
- Threshold: When the average number of accounts per CSM creeps past 75, it automatically triggers the hiring process for a new CSM.
This simple rule, tracked right on the scorecard, takes the emotion and guesswork out of hiring. It ensures the support team scales right alongside the customer base, preventing team burnout and keeping service quality high.
The value here is undeniable, which is why the global business intelligence software market is set to rocket past $151.26 billion by 2034. Companies everywhere are chasing the efficiency that comes from being data-driven. As new tech like AI gets baked into these tools, scorecards are only going to get smarter and more essential.
Building Your First Business Intelligence Scorecard
Putting together your first business intelligence scorecard might seem like a massive undertaking, but it doesn’t have to be. If you break it down into a clear, strategic framework, any SaaS leader can create a powerful tool that delivers insights right away. Let’s skip the dense theory and jump into a practical, step-by-step process.
Think of it like building a high-performance engine. You have to choose each part with care and connect everything in the right order for the whole system to purr.
Step 1: Define Your Ultimate Strategic Goal
Before you even think about data or metrics, stop and ask: What’s our company’s North Star? What is the single most important thing we need to achieve in the next 12-18 months? Maybe it’s conquering a new market, finally hitting profitability, or becoming the undisputed leader in product innovation.
This top-level goal is the anchor for every other decision you’ll make. Without it, your scorecard will just be a random collection of numbers that don’t tell a coherent story.
Your scorecard’s main job is to tell you if you’re getting closer to or further away from that one ultimate goal. Every metric should be a supporting character in that story.
Step 2: Choose Your Core Business Perspectives
With your North Star set, the next move is to break it down into the core areas of your business, or “perspectives.” These are the strategic pillars that hold up your main objective. For a typical SaaS company, these often look like:
- Customer: How do our customers really see us? This is all about retention, satisfaction, and loyalty.
- Financial: How do we look to our shareholders and investors? This covers revenue, profitability, and financial health.
- Product: Is our product actually delivering value and keeping users hooked? Think adoption rates, feature usage, and performance.
- Team & Operations: Are our people and processes set up to win? This includes things like employee happiness and operational smoothness.
Sticking to just 3-4 perspectives gives you a balanced view. It stops you from doing something like chasing revenue growth so hard that you sacrifice customer happiness along the way.
Step 3: Select a Handful of Meaningful KPIs
This is where so many teams go off the rails. The aim isn’t to track every metric under the sun. It’s to pick the vital few that truly show progress toward your goals. For each perspective you chose, select just 2-3 high-impact Key Performance Indicators (KPIs).
Focus on metrics you can act on, not just ones that make you feel good (vanity metrics). For instance, instead of just tracking website visitors, measure your MQL-to-SQL conversion rate. That’s a number you can actually improve. Our guide on the link between KPIs and scorecards dives deeper into making these tough choices.
As you build your first BI scorecard, getting the right people involved is key; you can get a better handle on this by understanding the roles of data analysts and data scientists.
Step 4: Pick the Right BI Tool
Once you have a solid strategic framework, it’s time to find the right tech to bring it to life. Leading business intelligence software is essential here. For example, Microsoft Power BI holds over 30% of the market and serves 30 million active monthly users with great scorecard features. Tableau, with about 17% of the market, is another fantastic option known for its powerful visualizations. Their popularity alone shows how critical these tools have become.
Look at how this Power BI example uses clear status indicators (green, yellow, red) and trend lines. It makes it incredibly easy to see how you’re doing at a glance.
Step 5: Design for Absolute Clarity
How you present the information is just as critical as the data itself. The best scorecards are so simple and clean that anyone can understand them in less than 60 seconds.
Visual Best Practices Checklist:
- Use a Traffic Light System: Red, yellow, and green are universally understood signals for performance.
- Add Trend Indicators: Is a metric going up, down, or staying flat? Simple arrows (↑, ↓, →) work perfectly.
- Keep It Simple: Resist the urge to add cluttered charts or fancy graphics. The numbers and their status should be the star of the show.
- Assign Clear Ownership: Every single KPI on that scorecard needs a designated owner who is accountable for its performance.
Step 6: Launch and Drive Adoption
Finally, a scorecard is worthless if it just collects digital dust in a folder somewhere. Launch it with your leadership team. Make it the centerpiece of your regular strategy meetings. Use it to guide conversations, celebrate wins, and figure out what’s not working.
It’s this consistent, active use that turns a simple report into a powerful management system.
Common Pitfalls to Avoid with BI Scorecards

Putting business intelligence scorecards into place can be a game-changer for any SaaS company, but they’re certainly not a magic bullet. True success comes from steering clear of the common traps that can turn a powerful strategic tool into just another report nobody reads.
Knowing these pitfalls upfront is half the battle. If you can anticipate these common, well-intentioned mistakes, you can build a scorecard that actually guides your strategy instead of just looking pretty in a presentation.
Choosing Vanity Metrics Over Actionable Ones
One of the most common mistakes I see is packing a scorecard with metrics that look great on the surface but don’t say a thing about the actual health of the business. These are what we call vanity metrics. Think of it like this: obsessing over total social media followers is great for the ego, but tracking lead conversion rates from those channels tells you if your effort is actually making you money.
For a SaaS company, a classic example is focusing on total sign-ups instead of the activation rate—the percentage of new users who actually start using key features. A mountain of sign-ups means very little if those users never engage. An actionable metric gives you a clear signal to do something, while a vanity metric just gives you a false sense of security.
Your BI scorecard should be a tool for honest self-assessment, not a source of misleading validation. If a metric doesn’t help you make a better decision, it doesn’t belong on your scorecard.
Overloading the Scorecard and Causing Paralysis
In the drive to be “data-driven,” it’s incredibly easy to fall into the trap of tracking absolutely everything. This creates an overloaded scorecard that’s crowded, confusing, and ultimately, useless. When your team is staring at a wall of numbers, they often hit analysis paralysis, where the sheer volume of information makes it impossible to figure out what truly matters.
A scorecard is meant to be a simple, at-a-glance tool. It’s there to shine a light on the vital few metrics, not the trivial many.
Simple Rules to Avoid Overload:
- Stick to just 3-5 KPIs for each strategic goal or perspective.
- Ask this crucial question: “If this metric turned red, would we fundamentally change what we’re doing?” If the answer is no, cut it.
- Make sure every single metric has a clear owner who is responsible for it.
Failing to Connect Metrics to Strategic Actions
This might be the biggest pitfall of all. A scorecard that just shows numbers without connecting them to real-world actions is nothing more than a static document. It’s a report card, not a management tool. The entire point of a business intelligence scorecard is to shape behavior and drive your team’s execution.
For instance, if your “Customer Churn” metric is flashing red, what happens next? A well-designed scorecard system would link that metric directly to a specific action, like “Launch Customer Exit Survey Program” or “Improve New User Onboarding.” This creates a clear, direct path from insight to action.
Without that link, all you have is bad news with no plan to fix it. This is why it’s so important to compare where you are to where you want to be. You can learn more about this by reading our guide on how to perform gap analysis the right way.
By actively avoiding these missteps—choosing actionable metrics, keeping things simple, and tying data to real work—you can turn your BI scorecard from a simple report into the strategic compass your SaaS business needs to navigate growth.
Answering Your Top Questions
Even with a solid plan, you’re bound to have some questions when you start putting a BI scorecard into practice. It’s a powerful tool, and it’s smart to iron out the details. Here are some quick, straightforward answers to the questions we hear most often.
Scorecard vs. Dashboard: What’s the Real Difference?
This is a classic point of confusion, but the distinction is actually simple. It all comes down to purpose.
A BI scorecard is strategic. It’s your high-level guide, built to track performance against big, long-term goals. Think of it as answering the question, “Are we on track to win?” It uses simple visual cues—like red, yellow, and green—to show you progress at a glance.
A dashboard, on the other hand, is operational. It’s focused on the here and now, answering, “What’s happening in the business right now?” While a scorecard is a management tool for steering the ship, a dashboard is like the gauges in the engine room, monitoring real-time activity.
How Many KPIs Should a Scorecard Actually Have?
When it comes to the KPIs on your scorecard, less is definitely more. Simplicity is key. A common mistake is cramming it with every metric you can think of, which just creates noise and kills focus.
A business intelligence scorecard should bring clarity, not complexity. If a metric doesn’t directly tell you whether you’re winning or losing on a core strategic goal, it probably doesn’t belong.
As a great rule of thumb, aim for 3-5 critical KPIs for each major area of your strategy (like Financial, Customer, or Product). This constraint forces you to be ruthless and concentrate only on the numbers that truly move the needle.
What Are the Best Tools for Building a BI Scorecard?
The good news is you don’t need to build these from scratch. Most top-tier business intelligence platforms already have great features for creating and managing scorecards. The best choice really depends on your current tech setup, budget, and specific data sources.
Here are a few popular and highly effective options:
- Microsoft Power BI: It has dedicated “Goals” and “Metrics” features that are practically purpose-built for scorecards.
- Tableau: Known for its stunning and flexible visualizations, you can easily configure them into powerful, custom scorecards.
- Other Platforms: Don’t overlook tools like Sisense, Qlik, or Looker, which also offer strong capabilities for tracking KPIs against targets in a scorecard format.
Ultimately, the “best” tool is the one that plugs into your data seamlessly and is simple enough for your team to use consistently.
How Often Should We Update the Scorecard?
There’s no single right answer here—the perfect update schedule depends entirely on the rhythm of your business.
High-level, strategic goals like market share or customer lifetime value (LTV) don’t shift overnight. Updating them monthly or even quarterly is often plenty. For more immediate metrics that feed into those goals—like weekly sales demos or new MQLs—a weekly update makes more sense.
The trick is to match the scorecard’s refresh rate to your strategic review cycle. You want the data to be fresh enough to guide decisions without creating a ton of extra reporting work.
At SaaS Operations, we offer battle-tested playbooks and templates to help you build and implement effective BI scorecards and other key processes. Our plug-and-play SOPs are created by operators, for operators, to help you save time and grow faster. Explore our proven frameworks today.