Understanding KPIs and Scorecards Without the Jargon
Let’s clear up the confusion around performance management. At its heart, a KPI and scorecard system is like a health monitor for your business. Don’t picture a complex, intimidating panel of machines in a hospital. Instead, think of it as a simple fitness tracker on your wrist. It gives you clear, immediate feedback on your vital signs, showing you what’s working and where you need to adjust to reach your long-term goals.
Successful companies use these tools to make better decisions, avoid expensive missteps, and stay focused on what truly drives growth. Without a clear system, teams often get lost in data—drowning in endless spreadsheets that create more questions than answers. The key is to turn this raw data into actionable insights. It’s about measuring what matters, not just what’s easy to count.
KPIs vs. Scorecards: What’s the Difference?
A common point of confusion is how a Key Performance Indicator (KPI) relates to a scorecard. While they work together, they have very different jobs. A KPI is a single, specific metric that measures how you’re doing on one particular activity. A scorecard, on the other hand, is a collection of these KPIs, grouped together to give you a big-picture view of your progress toward your main business goals.
Think about it this way: a KPI isn’t just a random number. It’s a measure tied directly to a strategic goal, which is part of your company’s broader vision. This structure makes sure that day-to-day actions are always pushing the business toward its long-term objectives.
To make the distinction clearer, here’s a simple breakdown of how they differ.
KPIs vs. Scorecards: Key Distinctions
A clear comparison showing the fundamental differences between KPIs and scorecards in purpose, scope, and application.
| Aspect | KPIs | Scorecards |
|---|---|---|
| Purpose | Measure the performance of a single, specific activity. | Provide a complete view of performance across several strategic areas. |
| Scope | Narrow and focused (e.g., Customer Acquisition Cost). | Broad and strategic, often covering multiple parts of the business. |
| Application | Used for immediate operational tracking and adjustments. | Used for strategic management, communication, and keeping the team aligned. |
Ultimately, a KPI is like glancing at your speedometer while driving. A scorecard is the entire GPS navigation system. The GPS uses your speed, location, and traffic data (all individual KPIs) to show you the full picture of your journey and guide you to your final destination. Grasping this distinction is crucial for building a measurement system that energizes your team instead of bogging them down with pointless tracking.
Why Traditional Metrics Are Failing Modern Organizations
Many companies operate under a dangerous illusion: they believe they are data-driven just because they track financial results. But relying only on traditional financial metrics is like trying to drive a car by looking exclusively in the rearview mirror. These numbers tell you where you’ve been—how last quarter went, your annual revenue—but offer almost no insight into the road ahead. This quarterly tunnel vision can create strategic blind spots, leaving you vulnerable to market shifts and competitor moves you never saw coming.
Moving Beyond Yesterday’s News
To successfully find your way in today’s business environment, you need a more forward-looking guidance system. Think of it as a GPS for your strategy. A GPS doesn’t just show your current location; it processes real-time data on traffic, road closures, and your destination to suggest the best route. In the same way, a modern performance framework must include more than just financial history. This is where a strategic KPI and scorecard system becomes essential, moving beyond lagging indicators to provide a complete picture of business health.
The need for a more rounded approach led to the creation of frameworks like the Balanced Scorecard. Since its introduction in the early 1990s, it has become a fundamental tool for strategic planning. By the year 2000, Gartner reported that over 50% of large U.S. firms had adopted it to connect their day-to-day activities with their long-term vision and improve performance monitoring.
The Balanced Scorecard Approach
The main idea is to balance financial goals with other critical perspectives that drive future success. For example, a SaaS company can’t just fixate on Monthly Recurring Revenue (MRR); it must also track customer churn, product engagement, and the health of its internal processes. As you map out your company’s growth, understanding where you stand on the SaaS maturity model can help you identify which perspectives need the most attention.
The diagram below shows the typical structure of a Balanced Scorecard, illustrating how it links vision and strategy to four key areas of performance.

This structure ensures that no single area, like finance, overshadows others that are just as vital for sustainable growth, such as customer satisfaction or innovation. By integrating these different views, a KPI and scorecard framework helps avoid the measurement paralysis that comes from an overload of disconnected data points. Instead, it creates a clear and actionable story about your business’s journey.
The Four Perspectives That Actually Matter
To build a KPI and scorecard system that works, you have to stop trying to measure everything. Instead, focus on what actually drives results. The Balanced Scorecard framework helps by organizing your metrics into four critical perspectives. Each one tells a part of your company’s story, but together, they paint a complete picture to guide your strategic decisions.
Think of it like an orchestra. Each section—finance, customers, operations, and growth—plays a vital role. When they work in harmony, the result is a masterpiece. Let’s look at each of these perspectives.
1. The Financial Perspective
This is the traditional bottom line: are your strategies making you more profitable? Metrics here are usually lagging indicators, meaning they reflect past performance. They answer the essential questions that keep your business healthy.
- Key Questions: How do we look to our shareholders? Are we generating a strong return on our investments?
- Example KPIs: Monthly Recurring Revenue (MRR), Customer Lifetime Value (CLTV), and Gross Margin.
2. The Customer Perspective
This view forces you to see your business through your customers’ eyes. Are they happy? Do they feel valued? Strong performance here is often a leading indicator, giving you a sneak peek into future financial success. Happy customers tend to stick around and spend more.
- Key Questions: What do our customers think of us? Are we truly meeting their needs and solving their problems?
- Example KPIs: Net Promoter Score (NPS), Customer Churn Rate, and Customer Satisfaction (CSAT).
For a deeper look into this area, you might find our guide on proven customer success strategies helpful.
The following infographic shows how these different types of KPIs fit together to create a balanced view.
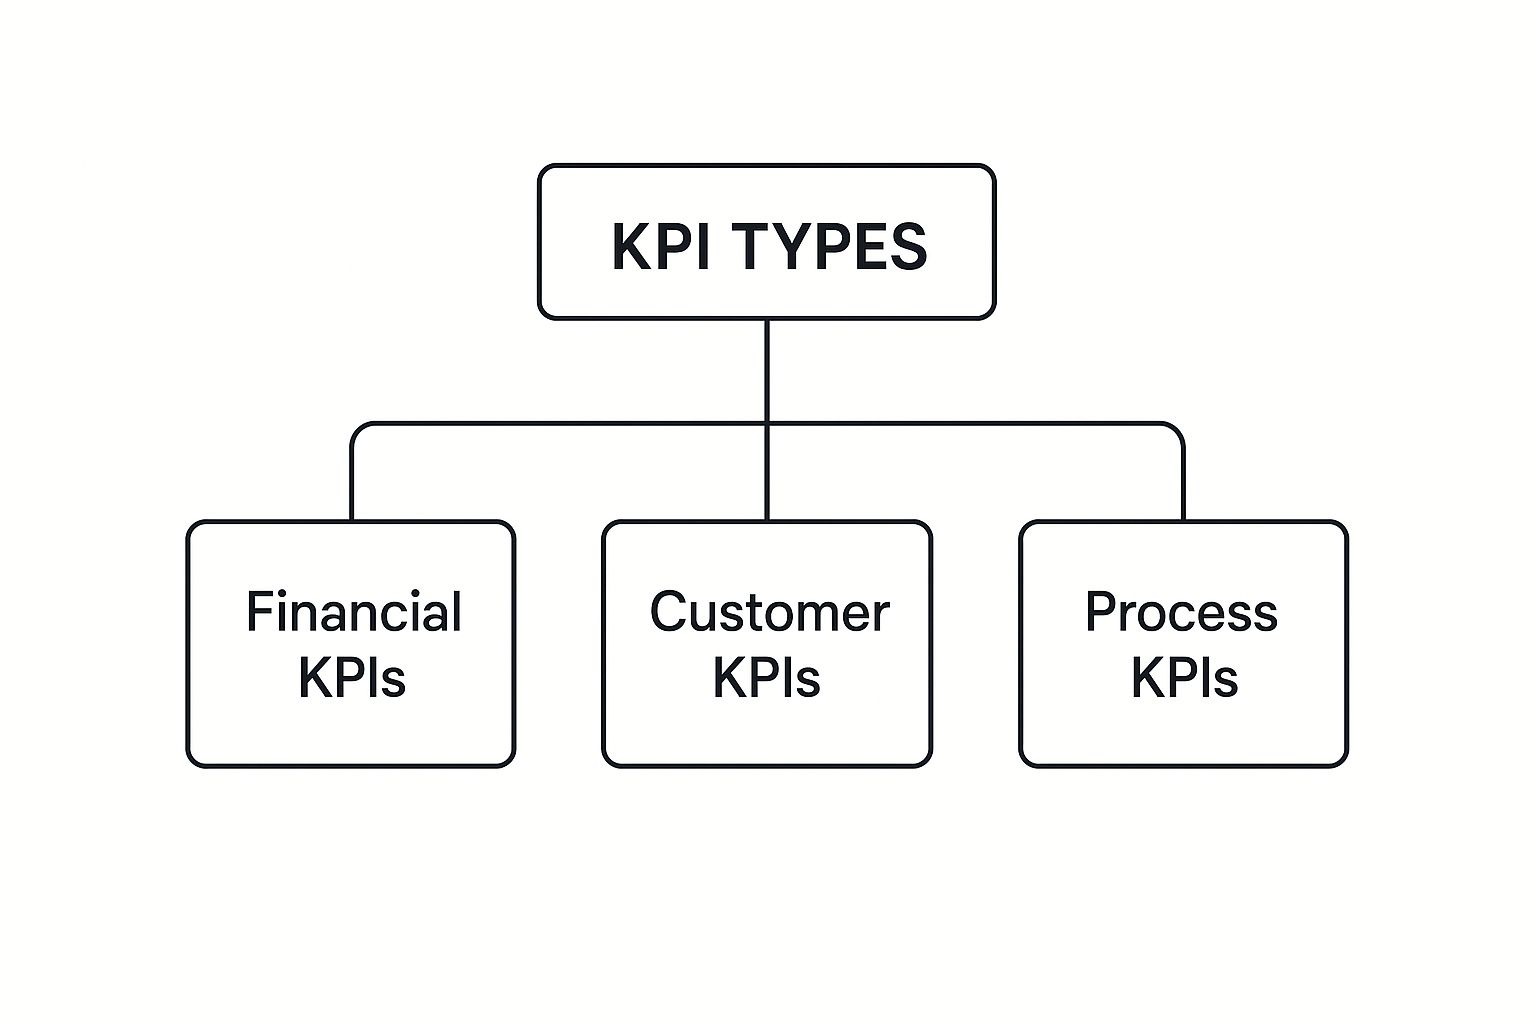
As you can see, a balanced approach means you’re not just measuring financial outcomes but also keeping a close watch on customer sentiment and how efficiently your business runs.
3. The Internal Process Perspective
This perspective turns the focus inward to operational excellence. It asks you to identify the critical internal processes you must perfect to keep both your customers and shareholders satisfied. This is where you fine-tune the engine of your business.
- Key Questions: What must we excel at internally to deliver on our promises? Where are our biggest operational bottlenecks?
- Example KPIs: Uptime/Downtime, Bug Resolution Time, and Feature Adoption Rate.
4. The Learning and Growth Perspective
The final view looks at your company’s capacity for future improvement and innovation. It centers on your people, systems, and procedures—the very foundation of long-term success. This is about building a company that can adapt and thrive for years to come.
- Key Questions: How can we continue to improve and create value? Are we equipping our team for the challenges ahead?
- Example KPIs: Employee Engagement Score, Time to Ramp for New Hires, and Number of Process Improvements.
To give you a clearer picture of how these perspectives work together, the table below breaks down each area with strategic questions and sample metrics.
The Four Perspectives of Balanced Performance
Detailed breakdown of the four key performance perspectives with examples of metrics and strategic objectives for each
| Perspective | Focus Area | Example Metrics | Strategic Questions |
|---|---|---|---|
| Financial | Profitability & Value | MRR, CLTV, Gross Margin | How do we look to our shareholders? Are our strategies improving the bottom line? |
| Customer | Satisfaction & Loyalty | NPS, Customer Churn, CSAT | What do our customers think of us? Are we meeting their needs effectively? |
| Internal Process | Operational Excellence | Uptime, Bug Resolution Time, Feature Adoption | What internal processes must we master to succeed? Where can we be more efficient? |
| Learning & Growth | Innovation & Improvement | Employee Engagement, Time to Ramp, Process Improvements | How can we continue to learn and create value? Are we building a culture of growth? |
This table shows that a truly balanced scorecard goes beyond just financial numbers. It connects what your customers think, how your internal operations perform, and your team’s ability to grow, creating a powerful framework for strategic execution.
Creating KPIs That Drive Action Instead of Confusion
Good KPIs are more than just numbers on a screen; they are signals that guide smart decisions and influence your team’s behavior. Many companies, however, fall into the trap of measuring what’s easy instead of what’s important. This creates a system that produces more noise than clarity. A truly effective KPI and scorecard system is built on metrics that inspire action, not just fill up a spreadsheet. The goal is to move from passive reporting to a dynamic framework that energizes your teams.
Distinguishing Signal from Noise
The first step is learning to separate vanity metrics from genuinely actionable ones. Vanity metrics, like total website visits or social media followers, might look impressive in a report but rarely connect to real business outcomes. They feel good to share but don’t tell you what to do next. An actionable KPI, on the other hand, is directly tied to a strategic goal and changes in response to specific things you do.
For example, instead of just tracking total sign-ups (a vanity metric), a SaaS company should focus on the conversion rate from trial to paid subscriber. This metric directly measures the value of your product and the effectiveness of your sales process.
Another key distinction is between leading and lagging indicators.
- Lagging Indicators: These metrics, like last quarter’s revenue or customer churn, measure past performance. They confirm whether your strategy worked, but by the time you see them, it’s too late to change the outcome.
- Leading Indicators: These are predictive metrics that give you a glimpse into the future. They track the activities that produce results, such as the number of product demos completed or the customer engagement score.
Focusing on leading indicators allows your team to be proactive. If you notice a dip in qualified leads, you can act immediately to fix your marketing funnel before it hurts next quarter’s revenue. Research on performance management has shown that companies concentrating on leading indicators are far more likely to hit their strategic targets.
This screenshot shows examples of different KPIs organized by business function, from sales and marketing to customer support.

The main point here is that each department’s KPIs should roll up to support the company’s bigger goals, creating a unified measurement system.
Building Your Action-Oriented KPIs
To make sure your KPIs motivate the right actions, they must be relevant to the people who are responsible for them. A customer support team can’t directly control Monthly Recurring Revenue (MRR), but they have a huge impact on the First Contact Resolution Rate and Customer Satisfaction (CSAT) scores. These are the metrics they should own and be measured against.
Here is a simple framework for creating KPIs that work:
- Start with the Objective: What specific business result are you trying to achieve? (e.g., “Improve customer retention.”)
- Identify Influential Actions: What activities directly affect this outcome? (e.g., “Proactive customer check-ins” or “Faster bug resolution.”)
- Define the Leading KPI: How can you measure these activities? (e.g., “Percentage of at-risk customers contacted per week” or “Average time to resolve critical tickets.”)
- Set Clear Targets: Define what success looks like with a specific, measurable goal (e.g., “Achieve an 85% CSAT score.”).
By following this process, you create a KPI and scorecard system that acts as a powerful guide, not a bureaucratic chore. It gives teams a clear connection between their daily tasks and the company’s most important goals, turning measurement into a source of motivation and alignment.
Designing Scorecards That Tell Your Success Story
Once you have your action-oriented KPIs picked out, the next step is to arrange them into a story. A truly effective scorecard is more than a list of numbers; it’s a visual narrative that communicates your strategy at a glance. Many dashboards fail because they are cluttered and confusing, which leads to them being completely ignored. The best scorecards use smart design to grab attention and make performance data understandable for everyone, from the executive team to frontline staff.
The design of your scorecard has a direct effect on how useful it is. Think of it like a well-designed infographic—it uses color, layout, and visual priority to guide your eye to what matters most. For instance, simple color-coding like red, yellow, and green instantly signals performance status without anyone needing to read every single number. This visual shorthand makes the information easy to digest and helps people respond faster.
Communicating Strategy Visually
A core principle of good scorecard design is strategic grouping. Instead of a long, jumbled list of metrics, organize your KPIs according to the four perspectives: Financial, Customer, Internal Process, and Learning & Growth. This structure not only makes the information easier to find but also reinforces the strategic links between different parts of the business. When a team member sees their process metric right next to a customer satisfaction score, they immediately understand how their work contributes to the bigger picture.
Here is an example of a balanced scorecard dashboard that visually organizes KPIs across these four key perspectives.

This dashboard uses charts and color codes to provide a quick, intuitive overview of performance in each strategic area, turning raw data into a clear story.
The benefits of this structured approach are substantial. There’s strong evidence that using a Balanced Scorecard significantly boosts performance. Data shows that approximately 80% of organizations using a Balanced Scorecard reported improvements in operating performance, and about 66% saw an increase in profits. You can explore more about the impact of balanced scorecards on business results to see the full data.
Ultimately, your KPI and scorecard system should be a living tool that sparks productive conversations. It becomes the central document for meetings like your weekly check-ins and strategic reviews. A well-designed scorecard ensures these discussions are informed by data and focused on action. It becomes the single source of truth that aligns the entire organization, helping everyone understand the score and what they need to do to win. You can even integrate scorecard reviews into your formal meeting cadences using a structured agenda, like the one in our quarterly business review template.
Making Implementation Actually Stick This Time
Let’s be honest: you’ve probably seen it happen before. A new performance measurement plan is announced with great fanfare, only to fizzle out within a few months. Most KPI and scorecard initiatives fail not because the metrics are flawed, but because the human side of the equation is overlooked. Success isn’t about creating the perfect dashboard; it’s about navigating resistance and building genuine support from the ground up.
The first 90 days are make-or-break. Without immediate and visible backing from leadership, the whole project can feel like another “flavor of the month” idea. Executives must do more than just sign off on the plan. They need to actively use the scorecard in their meetings, ask questions based on its data, and hold their teams accountable to the new metrics. This sends a clear signal that performance measurement is now a fundamental part of how the business runs.
Overcoming Resistance with Engagement
Resistance usually stems from fear—fear of being micromanaged, judged unfairly, or buried in extra work. The best way to address this is to make performance management feel helpful, not forced. This begins by involving teams directly in the process.
- Ask for input: Talk to your frontline employees. Ask them what metrics they think truly capture their performance and challenges.
- Explain the “why”: Show how the scorecard will help them succeed, not just how it will help management keep track of them.
- Provide training: Make sure everyone knows how to read the scorecard and understands what they can do to influence the numbers.
When you engage teams, they shift from being passive subjects of measurement to active partners in the strategy. This is a core principle in effective SaaS operations management, where team alignment has a direct effect on customer results and growth.
This image shows a template for a balanced scorecard, which helps break down big objectives into clear, manageable metrics.
Using a structured template like this one can make the process feel less overwhelming and helps ensure you’re looking at the business from all important angles right from the start.
Building a Sustainable Measurement Culture
A successful rollout doesn’t end with a launch; it creates a lasting culture of measurement. This means weaving the KPI and scorecard into the company’s daily, weekly, and monthly routines—like team huddles, monthly reviews, and quarterly planning. This approach has become so established that it’s now backed by formal education. Since 2006, over 7,500 professionals worldwide have earned certifications in Balanced Scorecard, KPI, or OKR development. As you can learn more about professional KPI certifications, it’s clear there’s a global trend toward making data-informed management a standard business practice.
Making measurement an integral part of your company’s DNA is the only way to ensure it truly sticks this time.
Your Performance Management Action Plan
Turning your measurement methods from a simple data-gathering task into a real strategic advantage needs a clear roadmap. This plan lays out the journey in simple, manageable steps. The goal is to make sure your KPI and scorecard system delivers actual business results right from the start. Instead of trying to build a perfect, massive system all at once, focus on putting things in the right order to get the biggest impact and build momentum with early successes.
Phase 1: Foundation and Alignment (Weeks 1-2)
The first couple of weeks are all about building a solid base. Success at this stage isn’t measured by metrics; it’s about getting everyone on the same page. Without this shared understanding and commitment, even the most technically perfect scorecard is doomed to fail. Your objective is to get buy-in from leadership and clarify the strategic priorities your new system will track.
- Secure Executive Sponsorship: Find an active, visible champion on your leadership team. This person should be someone who will actively use the scorecard to make decisions and guide their teams.
- Form a Cross-Functional Team: Put together a small group with people from key departments like sales, marketing, product, and customer success. This ensures you get a variety of perspectives and that the final system works for everyone.
- Clarify Strategic Objectives: Run a workshop to agree on the 3-5 most important strategic goals for the next 12 months. This step is critical for connecting your company’s big-picture vision to the day-to-day work, a concept we explore in our guide on operational vs. strategic planning.
Phase 2: Metric Development and Quick Wins (Weeks 3-4)
Now it’s time to turn those high-level strategic goals into numbers you can track. The secret here is to start small. Identify a handful of high-impact KPIs that will show value almost immediately. This builds confidence across the company and proves the system’s worth early in the process.
- Draft Initial KPIs: For each strategic goal, brainstorm a few leading and lagging indicators. For your very first scorecard, aim for no more than 8-10 KPIs in total.
- Establish Baselines: Before you can set goals, you need to know where you are. Gather the initial data for your chosen KPIs to understand your current performance.
- Set Initial Targets: Create a simple “Red-Yellow-Green” system for each metric. This visual guide makes it easy for anyone to see the status of a KPI at a glance.
By following this step-by-step approach, you can build a KPI and scorecard framework that your teams will actually use and appreciate. This turns measurement from a chore into a core part of how your business operates.
Ready to stop guessing and start growing? At SaaS Operations, we provide the battle-tested playbooks and templates to build performance management systems that accelerate growth. Discover our proven frameworks today.