Net Revenue Retention Formula: The Definitive Guide for SaaS Operators
Forget vanity metrics. If you had to pick one number to reveal the true health of your SaaS business, it would be Net Revenue Retention (NRR). It’s the ultimate reality check.
Think of your customer base as a portfolio. NRR tells you if your existing assets are compounding in value on their own, or if you're constantly fighting losses just to break even. It separates sustainable growth from the frantic chase for new logos.
While new customer acquisition is crucial, durable growth is built on the customers you already have. A strong NRR is proof you’ve built a product that customers not only stick with but integrate deeper into their operations, spending more over time. That is the foundation of a capital-efficient, high-value SaaS company.
Why NRR Is Your Most Important Health Metric
So, what exactly does the net revenue retention formula measure? At its core, it’s a simple tug-of-war between revenue growth and revenue loss within a fixed group of customers over a specific period.
Three forces are at play:
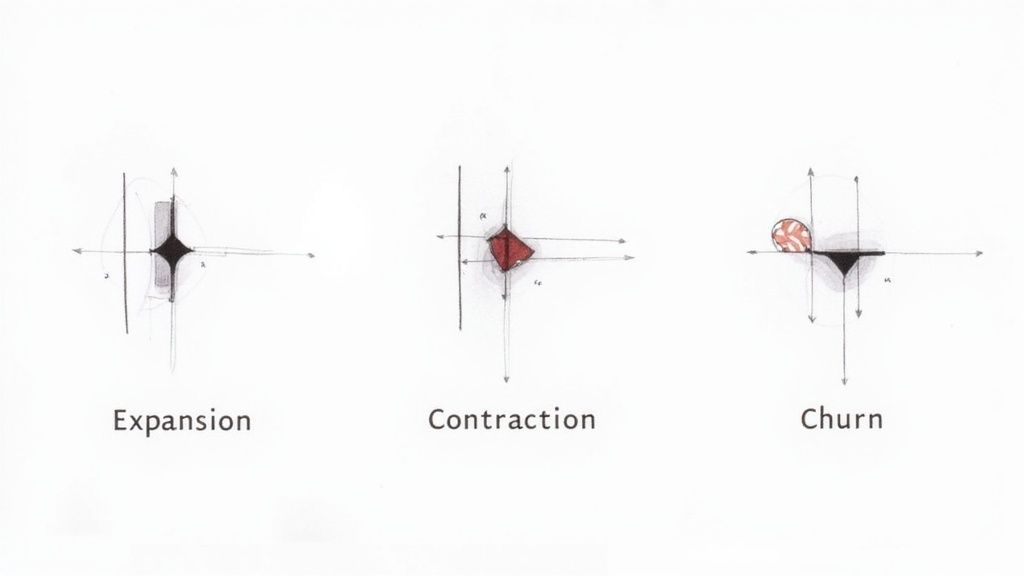
- Expansion: This is your growth engine. It's the new revenue gained from existing customers through upgrades, cross-sells, or increased usage. SaaS leader Twilio, for example, built its empire on usage-based expansion, with NRR consistently over 130%.
- Contraction: This is the revenue leak from customers downgrading plans or reducing seats. It's an early warning that a customer's needs have changed or they're becoming disengaged.
- Churn: This is the total revenue lost when a customer cancels completely. Churn is the single biggest drag on your NRR and a direct hit to your growth momentum.
The official formula is: (Starting Revenue + Expansion – Contraction – Churn) / Starting Revenue × 100%.
Let's make that real. Say you start the month with $100,000 in monthly recurring revenue (MRR). Over that month, you gain $25,000 in expansion from happy customers, but you also lose $8,000 to contraction (downgrades) and $7,000 to churn (cancellations).
Plugging that into the formula, your NRR is 110%. You can learn more about this core SaaS metric and see how it’s calculated by industry leaders.
In a nutshell, NRR answers one critical question: "If we stopped acquiring new customers today, would our business still grow?" An NRR over 100% means the answer is yes. That's a self-sustaining growth engine that signals deep product-market fit and builds immense long-term value.
Calculating Your Net Revenue Retention The Right Way
Let's get tactical. This isn't just an abstract concept—the net revenue retention formula is a powerful, practical tool for any SaaS operator. We're going to walk through exactly how to calculate it, using scenarios you'll actually encounter.
The formula compares the revenue from a specific cohort of customers today versus what you earned from them at the start of a period.
Net Revenue Retention (NRR) = (Starting MRR + Expansion MRR – Contraction MRR – Churned MRR) / Starting MRR x 100%
Think of it this way: Starting MRR is your baseline. Expansion MRR is new revenue from upgrades and cross-sells. Then you have the leaks—Contraction MRR from downgrades and Churned MRR from cancellations.
This flow chart paints a perfect picture. You start with a bucket of revenue, some leaks out (churn and contraction), but you also pour more in from the customers you already have (expansion).
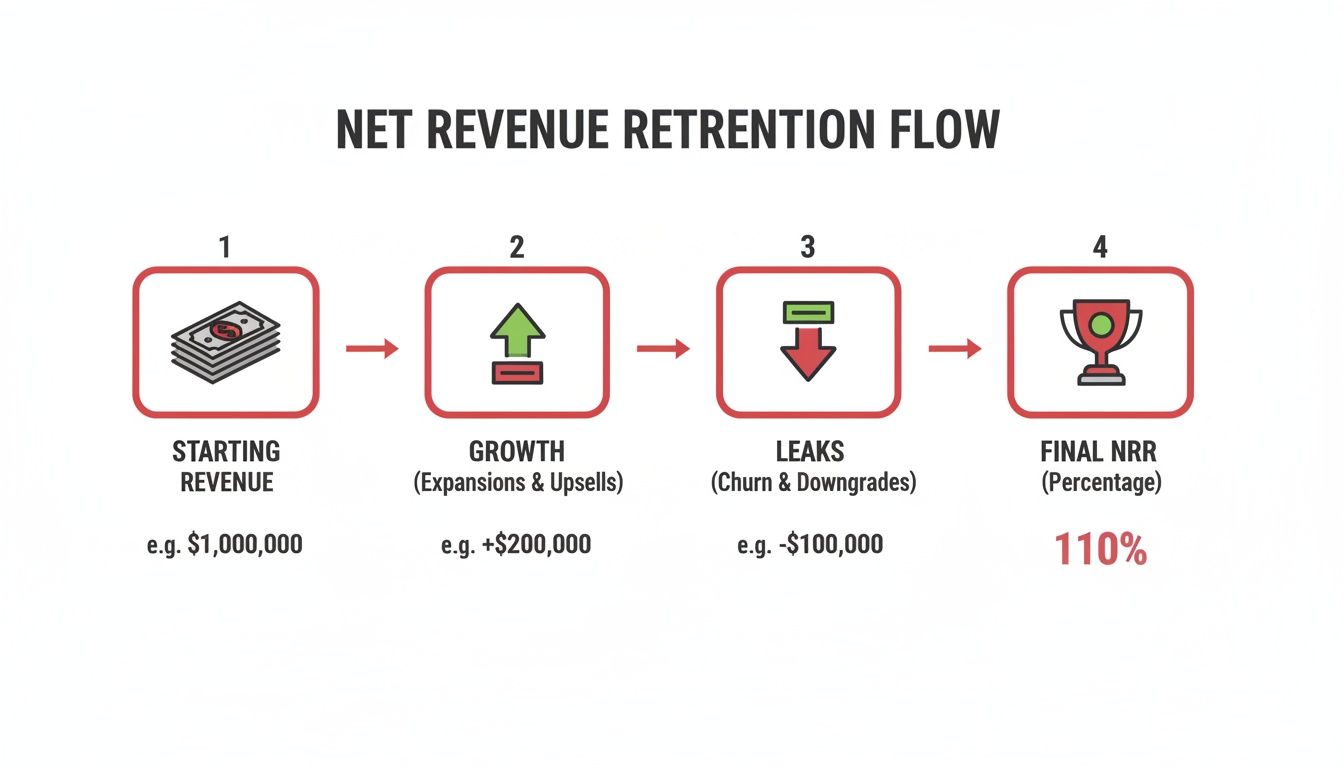
The magic of NRR is that you can spring a few leaks and still grow. If your expansion revenue is strong enough to more than cover your losses, you can hit an NRR over 100%. That’s the goal.
A Monthly NRR Calculation Example
Let's run the numbers for a typical SaaS company. On May 1st, your Starting MRR from your existing customer base is $200,000.
Over the course of May:
- Expansion MRR: Happy customers upgraded their plans, adding $30,000 in new MRR.
- Contraction MRR: A few clients downgraded, reducing revenue by $5,000.
- Churned MRR: You lost a few customers, resulting in a $12,000 loss in MRR.
Now, let's plug those numbers into our formula:
- NRR = ($200,000 + $30,000 – $5,000 – $12,000) / $200,000
- NRR = $213,000 / $200,000
- NRR = 106.5%
That’s a healthy NRR. It means for every dollar you started the month with, you ended it with almost $1.07 from that same group of customers. This is a business building momentum.
Common Pitfalls to Avoid in Your Calculation
Garbage in, garbage out. A skewed calculation will lead you to make bad decisions. I've seen countless operators trip up on the details.
Here are the most common mistakes to avoid:
- Including one-time fees: NRR is exclusively about recurring revenue. Exclude setup fees, professional services, and any other one-off charges.
- Mishandling discounts: When a customer's temporary discount expires, the resulting revenue increase is expansion. Conversely, applying a new discount is a contraction.
- Incorrectly timing churn: A customer churns when their subscription ends and revenue stops—not when they simply signal their intent to cancel.
Nailing these details is non-negotiable for a true pulse on your business.
For operators looking to build a repeatable process, our free net revenue retention tools and templates ensure your calculations are consistent and accurate. It removes the guesswork and gives your entire team a metric they can trust.
Benchmarking Your NRR Against Top SaaS Companies
So, you have your NRR. The immediate question is, "Is this good?" A number without context is useless. To set meaningful goals and understand your performance, you must benchmark against the industry.
This isn't just an ego check. A strong NRR is one of the clearest signals to investors of product-market fit and customer loyalty. Knowing what "good" looks like for a company your size and stage helps you set ambitious but realistic targets.
NRR Benchmarks By Company Stage
NRR naturally evolves as a company matures. Early-stage startups are often focused on landing new logos. As you scale, the focus shifts to maximizing revenue from the existing customer base.
Data shows NRR tends to improve as companies grow. Early-stage companies might hover around 100%. But once you hit the scale-up stage—say, $15M–$30M in ARR—the median NRR creeps up to 104–106%. Public SaaS leaders often exceed 115%.
This progression makes sense. As you scale, you build a dedicated customer success function, refine pricing and packaging to drive upgrades, and your product becomes stickier with more expansion opportunities.
Bottom line: as you grow, your ability to expand existing accounts must become a more powerful growth engine. Your NRR is the ultimate scorecard for how well you're building that engine.
Why Your Business Model Matters
Who you sell to has a massive impact on what constitutes a "good" NRR. A SaaS company serving SMBs will have a vastly different NRR profile than one selling to large enterprises.
Here’s a practical breakdown:
- SMB-Focused SaaS: You're dealing with inherently higher churn. Small businesses fail or switch tools more frequently. A median NRR of 90-100% is standard, and exceeding 100% is a significant achievement.
- Enterprise SaaS: These customers are stickier with higher switching costs. With dedicated success managers and vast expansion opportunities, the median NRR is often in the 110-120% range. Outliers like Snowflake famously reported NRR over 150%.
Understanding where you fit is key to setting the right targets. To get a better feel for the numbers that matter for your specific model, check out our guide to SaaS metrics benchmarks.
This table provides a clearer picture of how NRR breaks down by company ARR and average deal size (ACV).
SaaS NRR Benchmarks by Company Stage and ACV
This table shows the median and top-quartile Net Revenue Retention rates for SaaS companies, segmented by Annual Recurring Revenue (ARR) and Average Contract Value (ACV).
| Segment | Median NRR | Top Quartile NRR |
|---|---|---|
| <$10M ARR, <$25k ACV | 96% | 110% |
| <$10M ARR, >$25k ACV | 102% | 115% |
| >$10M ARR, <$25k ACV | 101% | 114% |
| >$10M ARR, >$25k ACV | 108% | 120% |
| All Companies | 102% | 116% |
(Source: Data aggregated from multiple industry reports, including RevOps Co-op and Bessemer Venture Partners.)
As you can see, both company size and customer size play a huge role. Companies with higher ARR and larger contract values consistently post higher NRR. Use this as a guide to see which quadrant you fall into and what your peers are achieving.
The Three Levers That Control Your NRR
Knowing the NRR formula is step one. To actually improve it, you need to pull the right levers. Your NRR is controlled by three direct inputs: Expansion, Contraction, and Churn. Mastering each is how you turn your customer base into a self-sustaining growth engine.
These are not abstract concepts; they are the direct inputs that determine your growth from existing customers. Let’s break down actionable plays for each.
Lever 1: Expansion Revenue
Expansion is your growth accelerator. It’s the most efficient way to grow because the customer trust is already established. Your job is to make it a no-brainer for them to get more value from your platform.
Here are proven expansion plays that top operators use:
- Structure Pricing for Expansion: Design your pricing around a value metric that grows with the customer (e.g., users, contacts, projects). Slack is a masterclass; as teams grow, they naturally hit usage limits and upgrade, often without sales intervention.
- Systematize Cross-Sells: Don't leave cross-sells to chance. Use product usage data to identify customers who have mastered one module and are prime candidates for another. HubSpot built an empire by turning free CRM users into paying customers for its Marketing, Sales, and Service Hubs.
- Build a Clear Upgrade Path: Make the jump to the next plan irresistible. Map your tiers to your customers' maturity curve. Solve their next big problem with features, limits, or support available only in higher tiers.
Lever 2: Contraction Revenue
Contraction is the silent killer of NRR. It’s the revenue lost when customers downgrade or reduce usage. Treat it as a critical warning sign that often precedes churn. This is your moment to intervene.
Your job is to identify at-risk signals before the downgrade request comes. Is product usage dropping? Did their primary champion leave the company? Are support tickets spiking? These are all red flags.
A proactive customer success team is your defense here. Actionable Next Step: Implement a "Health Score" system. Combine product usage data (e.g., daily logins, key feature adoption) with CSM input to flag at-risk accounts. When a score drops below a certain threshold, trigger a playbook that includes outreach from the CSM to diagnose the issue and offer solutions. We detail this in our customer success playbook.
Lever 3: Customer Churn
Churn is the most painful drag on your NRR. While zero churn is impossible, a significant portion is preventable and can be traced back to a few root causes.
Churn is rarely a surprise. It’s the final outcome of a series of small failures: a poor onboarding experience, a critical feature that doesn't work as expected, or a competitor solving their problem better.
To fight churn, go beyond exit surveys. Actionable Next Step: Conduct a "First 30 Days" audit. Analyze the onboarding journey of your last 20 churned customers versus your last 20 successful ones. Did they complete key setup steps? Did they adopt sticky features? Identify the specific drop-off points in your onboarding process and fix them. This is the only sustainable way to plug the leaks.
Your Operational Playbook for Driving Higher NRR
Knowing your NRR is one thing; systemically improving it is another. To move from passive measurement to active management, you need an operational playbook—a set of repeatable processes that embed NRR improvement into your company's DNA.
This isn't about one-off initiatives. It's about building a system to monitor the right signals and ensure cross-functional alignment.
The first step is creating visibility. You need a dashboard that tracks the leading indicators of NRR—the signals that predict where your retention is headed before it hits the P&L.
This dashboard becomes your single source of truth, turning an abstract goal like "improve NRR" into concrete metrics that every team can act on.
Building Your NRR Dashboard
Your NRR dashboard should be simple and actionable. Focus on metrics that are strong predictors of customer health and expansion potential.
Here’s your starting template:
- Product Adoption Scores: Track the percentage of customers actively using your top 3 "sticky" features. Low adoption is a direct precursor to churn.
- CSM Health Scores: Implement a simple Red/Yellow/Green rating system that Customer Success Managers update after key check-ins. This captures crucial qualitative insights that data alone will miss.
- Support Ticket Trends: Monitor ticket volume and sentiment by account. A sudden spike can signal frustration (churn risk) or deeper engagement (expansion opportunity).
Operational efficiency is key to executing this playbook at scale. For instance, using tools like AI for operational efficiency improvement can help automate the detection of these trends and trigger workflows for your team.
Assigning Clear Ownership
A playbook is useless without clear roles. Without explicit ownership, critical tasks will be dropped.
Improving NRR isn't just a "customer success problem." It requires a coordinated effort across Product, Sales, and CS, with each team owning specific inputs that drive the final number.
Actionable Next Step: Use this RACI chart as your starting point:
- Customer Success: Accountable for the overall NRR metric. Responsible for CSM health scores, conducting Quarterly Business Reviews (QBRs), and executing retention playbooks.
- Product: Accountable for product adoption scores. Responsible for building a feature roadmap that creates natural expansion pathways and addresses key drivers of churn.
- Sales/Account Management: Accountable for Expansion MRR. Responsible for acting on expansion opportunities identified by CS and product usage data to close upsell and cross-sell deals.
This structure creates true accountability. For operators building this system, our library of SaaS playbooks provides ready-to-use templates for assigning roles and running effective cross-functional meetings.
Ultimately, the goal is to create a repeatable process that makes improving net revenue retention a core part of your company's operating rhythm.
How Small NRR Gains Create Massive Enterprise Value
Net Revenue Retention is far more than another dashboard metric. It’s the secret ingredient investors prize because it signifies a capital-efficient, self-sustaining growth engine. An NRR over 100% is a game-changer—it proves you can grow revenue without signing a single new customer.
Think about that. Your existing customer base isn't just staying; they're actively investing more. This creates a compounding effect that massively inflates your valuation. A few percentage points of NRR can fundamentally alter your company's growth trajectory and capital efficiency.
It's the difference between being on a hamster wheel, constantly spending to replace lost customers, and building a flywheel that gains momentum on its own.
The Compounding Power of NRR
Let's run the numbers to see the real-world impact.
Imagine two SaaS companies, both starting at $10 million in ARR. Company A has a good NRR of 105%. Company B has a best-in-class NRR of 115%.
Assuming neither company signs a single new customer for five years, here’s what happens to their revenue from that initial cohort:
- Company A (105% NRR): Their ARR grows to $12.8M.
- Company B (115% NRR): Their ARR balloons to $20.1M.
That 10-point gap in NRR didn't just add a little extra revenue—it doubled the ARR from the starting cohort. This is why fighting for every percentage point of NRR is worth it. You can model this impact for your own business using our ARR valuation calculator.
A strong Net Revenue Retention rate is crucial for demonstrating the long-term viability and growth potential of your business, especially when building an investor-ready financial modeling for startups. It showcases your ability to not only retain customers but also grow revenue from your existing base, directly influencing enterprise value.
This isn't just hypothetical. An analysis of public SaaS companies by Ordway Labs found that lifting net retention from 100% to 120% turns a $10M customer cohort into a $12M cohort in just one year. That effect then compounds across the entire business.
Every small victory in customer retention and expansion builds a more durable, valuable company.
Got Questions About Net Revenue Retention? We've Got Answers.
Even experienced SaaS operators get tripped up by the nuances of Net Revenue Retention. Let's clarify the most common questions.
What’s the Real Difference Between NRR and GRR?
Think of it as offense versus defense. Gross Revenue Retention (GRR) is pure defense. It measures how much revenue you retained, excluding any expansion. The formula is (Starting MRR – Contraction MRR – Churned MRR) / Starting MRR. GRR can never exceed 100% and is a stark measure of your "leaky bucket." A GRR of 90%+ is considered best-in-class for enterprise SaaS.
Net Revenue Retention (NRR), on the other hand, plays both defense and offense. It includes all expansion revenue. NRR answers the bigger question: "Is our existing customer base a growth engine?" You might have a solid 90% GRR but a stellar 115% NRR. That signals a healthy business that is not just retaining customers, but actively growing them.
How Often Should We Be Looking at NRR?
For operational teams—Customer Success, Product, Account Management—you must track NRR on a monthly basis. This provides a tight feedback loop to see if your initiatives are working and allows you to react quickly to negative trends.
For strategic planning, board meetings, and investor updates, you will report NRR on a quarterly and annual basis. The monthly numbers provide the real-time pulse; the quarterly and annual figures show the long-term health and trajectory of the business.
Can Our NRR Be Over 100% Even with High Churn?
Technically, yes, but this is a dangerous scenario. It's possible for massive expansion from a few large accounts to mask high churn among your smaller customers. Your NRR might look healthy, but your business is developing a risky concentration problem, becoming overly dependent on a few "whale" accounts. The most durable SaaS businesses pair a high NRR with strong logo retention, proving their value across the entire customer base.
At SaaS Operations, we provide the battle-tested playbooks and SOPs that help operators turn metrics like NRR into scalable growth. Stop guessing and start executing. Get the frameworks you need at https://saasoperations.com.