Before you start crunching numbers in a free TAM calculator, let's talk about why this matters so much. Your Total Addressable Market (TAM) isn't just some fluffy number to impress investors on a slide. It’s the bedrock of your entire growth strategy. Get it right, and you're building on solid ground. Get it wrong, and you could be building on quicksand.
Why Nailing Your TAM Is a SaaS Game-Changer
Think of your TAM as the total revenue you could possibly earn if every single potential customer bought your product. It’s the ceiling for your growth. When Airbnb was starting out, they didn't just look at the hotel industry. Their TAM calculation included the entire travel and experience economy, which they pegged at a staggering $3.4 trillion. That big-picture thinking is what helped them justify their world-changing ambitions.
But this isn't just about fundraising. A well-researched TAM filters down into almost every strategic decision you make.
It Sharpens Your Go-To-Market Strategy
Your TAM essentially draws the map of your battlefield. It shows you who your ideal customers are, how many of them there are, and what the ultimate prize looks like. Without that clarity, your marketing team is just guessing, burning cash on campaigns aimed at the wrong people or, worse, a market that’s too small to ever hit your revenue goals.
A solid TAM helps you nail down the big questions that drive your GTM plan:
- Who’s our real Ideal Customer Profile (ICP)? Calculating your TAM forces you to get brutally honest about the industries, company sizes, and regions you can realistically serve.
- Where do we spend our marketing dollars? A massive, spread-out market might demand a heavy investment in digital ads. A super-niche one? You're probably better off with a targeted direct sales or ABM approach.
- How do we price this thing? Knowing the total economic value up for grabs in your market gives you a much better feel for what you can charge and what your revenue per customer could be.
A deep understanding of your market size is one of the first real steps toward finding product-market fit. You can't fit a product to a market you don't understand.
From the Field: "A poorly calculated TAM is the silent killer behind a failed GTM strategy. I've seen operators hire a dozen sales reps for a market that can only support two, or they underinvest in what turns out to be a massive, untapped goldmine. This is a core operational metric, not just a fundraising talking point."
It Aligns Your Product and Hiring Plans
Your TAM is also a huge signal for your product and HR teams. Let's say your research uncovers a huge, underserved slice of your market. Boom—that’s a clear sign for your product team to start prioritizing features that solve that segment's specific pains.
It takes the guesswork out of your roadmap. The same goes for hiring. Knowing the real size of your serviceable market helps you set sales quotas that are ambitious but achievable. It tells you whether you need a team of 5 or 50 to attack the opportunity without torching your runway.
For anyone running SaaS operations, tying your TAM back to your main KPIs is non-negotiable. We dive deeper into this in our guide to https://saasoperations.com/saas-metrics-benchmarks/. It gets everyone—from sales and marketing to product and finance—rowing in the same direction toward a clearly defined goal.
Choosing Your TAM Calculation Method
Picking the right way to calculate your Total Addressable Market (TAM) is like choosing the right map for a journey. A satellite image gives you the big picture, a street map shows you the immediate route, and an economic blueprint helps you build something from scratch. Each perspective is valid, but the one you choose will fundamentally shape your strategy.
Your choice between a Top-Down, Bottom-Up, or Value Theory approach isn't just a mental exercise. It’s the difference between a fuzzy estimate and a rock-solid plan, and it directly impacts the credibility of the numbers you’ll eventually plug into any free TAM calculator. Let’s break down the playbook for each.
Top-Down Analysis: The 30,000-Foot View
The top-down approach is all about starting big and whittling it down. You grab a massive market size figure from a credible source—think Gartner, Forrester, or a respected industry report—and then slice away the parts that don't apply to you.
Actionable Playbook:
- Source a Report: Find a recent industry report from a reputable firm (e.g., Gartner, IDC) stating the total market size. For instance, the "Global CRM Software Market."
- Apply Geographic Filters: If you only operate in North America, find the percentage of the global market that region represents (often found in the same reports).
- Apply Segment Filters: Layer on your specific niche. If you sell CRM to financial services companies with under 500 employees, you must find data or create defensible assumptions for what percentage of the North American market that represents.
- Result: Your TAM is the final, filtered number.
Example: The global project management software market is $5.6 billion (Gartner). North America is 40% of that ($2.24 billion). You estimate marketing agencies are 10% of that segment. Your top-down TAM is $224 million. It's fast, but be prepared for investors to challenge that 10% assumption.
Bottom-Up Analysis: Building From the Ground Up
This is the gold standard for operators. It’s the method VCs and seasoned executives prefer because it’s rooted in reality. Instead of starting with a huge, abstract number, you build your TAM by counting your actual potential customers and multiplying that by how much you can realistically charge them.
Actionable Playbook:
- Define Your ICP: Be ruthlessly specific. Industry, company size, geography, technology used, etc.
- Count Potential Accounts: Use tools like LinkedIn Sales Navigator, ZoomInfo, or industry databases to count the exact number of companies that fit your ICP.
- Determine Your ACV: Calculate your Average Annual Contract Value based on your pricing tiers and expected customer distribution. A weighted average is more credible than a simple average.
- Multiply: Total Accounts x ACV = TAM.
Example: For a PM tool targeting marketing agencies: a LinkedIn search reveals 8,000 North American agencies with 10-50 employees. Your weighted ACV is $2,500. Your TAM is 8,000 x $2,500 = $20 million. This number is smaller, but it’s defensible. It's built on a foundation of verifiable data you can actually build a sales and marketing plan around. This kind of detailed work is also a crucial input for creating more reliable financial models. If you want to dive deeper, check out our guide on different revenue forecasting methods for SaaS.
From the Field: "The Bottom-Up approach forces an honest conversation about who your customer really is. It’s less about the size of the ocean and more about the specific fish you are equipped to catch. Every SaaS leadership team needs to have that brutally honest discussion."
Value Theory: Sizing a Market That Doesn't Exist Yet
When you’re creating an entirely new category, you have to get creative with Value Theory. This method estimates your TAM based on the tangible, economic value your product delivers to a customer and how much of that value you can reasonably capture through pricing.
Actionable Playbook:
- Quantify the Pain: Identify the direct cost of the problem you solve. How much money do companies waste? How much revenue do they lose?
- Calculate Value Created: Show the math. "Our AI tool reduces ad spend waste by 20%." On a $500k ad budget, that's $100k in savings.
- Price Based on Value: Determine a price that is a fraction (e.g., 10-20%) of the value created, making it an easy "yes" for the customer. In the above example, a $10k/year price is a 10x ROI.
- Count Prospects: Identify the number of companies experiencing this level of pain.
- Multiply: Number of Prospects x Value-Based Price = TAM.
Example: An AI tool slashing ad waste by 20% for e-commerce companies. A company with a $500k ad spend saves $100k. You price your tool at $10k (10% of value). There are 15,000 companies that fit this profile. Your TAM is 15,000 x $10,000 = $150 million. This approach is incredibly powerful for disruptive tech because it ties your market size directly to your value proposition.
Diving In: How to Actually Use a Free TAM Calculator
Alright, let's get our hands dirty. Using a free TAM calculator can feel deceptively simple—you plug in a few numbers, and voilà, an answer appears. But the real magic, the part that separates a flimsy guess from a market analysis you can actually bank on, is in how you find and justify those numbers.
We'll walk through this using a fictional SaaS: 'ConnectSphere.' It's a project management tool designed specifically for remote marketing agencies. I'm choosing the bottom-up approach here because, frankly, it's the most credible and useful method for anyone actually running a business.
Step 1: Nail Down Your Total Number of Potential Customers
Before anything else, we need a solid count of our ideal customers. This isn't about a vague guess; it's a data-gathering mission. For ConnectSphere, our target is crystal clear: "remote marketing agencies."
Your job is to find a reliable source for this number. Don't just Google "how many marketing agencies." You need to turn to professional data platforms.
- LinkedIn Sales Navigator: This is the go-to for most B2B SaaS plays. Get incredibly specific, filtering by industry ("Marketing and Advertising"), location ("United States," "Canada"), company size ("11-50 employees"), and even keywords like "remote" or "distributed" in their company profiles.
- Industry Associations: Groups like the American Marketing Association (AMA) or specialized agency networks are goldmines. They often publish member directories or industry reports.
- Data Enrichment Services: For a more robust process, use tools like Clearbit or ZoomInfo to build a super-precise list of target accounts.
For our ConnectSphere example, let's say a deep dive on LinkedIn Sales Navigator shows there are 12,000 marketing agencies in the United States that perfectly match our size and "remote-first" criteria. That's our first critical input.
Pro Tip: Don't just grab a number and run with it. Cross-reference your findings. If one source says 12,000 and another says 5,000, dig in and understand the discrepancy. Your credibility hangs on the quality of this data.
Step 2: Determine Your Average Revenue Per Customer
Now you need to estimate how much revenue you can realistically expect from each of those 12,000 potential customers. This figure, often called Annual Contract Value (ACV), has to be rooted in your pricing strategy.
Let’s say ConnectSphere has three pricing tiers:
- Starter Plan: $1,000/year
- Pro Plan: $3,000/year
- Enterprise Plan: $8,000/year
A common mistake is to just average these three numbers ($4,000). A much smarter way is to create a weighted average based on how you expect customers to be distributed. After doing some customer discovery calls, the ConnectSphere team projects this breakdown:
- 60% of customers will likely choose the Starter Plan.
- 30% will go for the Pro Plan.
- 10% will need the Enterprise Plan.
The real math looks like this: ($1,000 * 0.60) + ($3,000 * 0.30) + ($8,000 * 0.10) = $2,300. This is our blended ACV. If you’re having trouble modeling this out, our pricing strategy calculator is a great tool for playing with different scenarios.
This infographic shows the different ways you can think about sizing up your market.
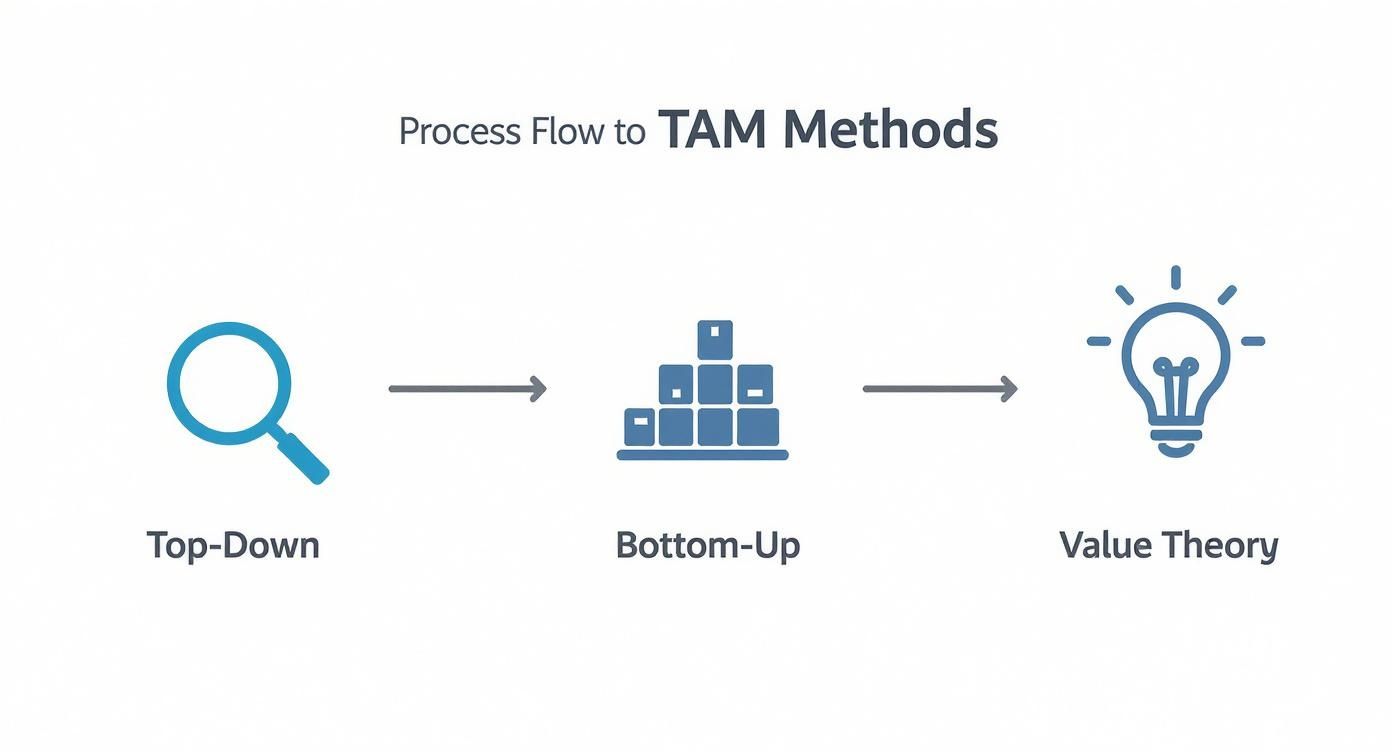
Starting with a broad Top-Down number is fine, but building a granular Bottom-Up case gives you a much more solid foundation to build your strategy on.
Step 3: Putting It All Together
Now that we have our two core inputs, the formula is dead simple:
Total Addressable Market = (Number of Potential Customers) × (Average Revenue per Customer)
For ConnectSphere:
- Number of Potential Customers: 12,000
- Average Revenue Per Customer (ACV): $2,300
TAM = 12,000 × $2,300 = $27,600,000
This $27.6 million is ConnectSphere's Total Addressable Market. It's a figure built on verifiable data and sensible pricing assumptions. That's the kind of number you can defend in any board meeting or investor pitch.
But we're not done yet.
Step 4: From TAM to SAM and SOM
Any decent free TAM calculator won't just spit out one big number. It should push you to think about your Serviceable Addressable Market (SAM) and your Serviceable Obtainable Market (SOM). This is where the TAM becomes an actual strategic tool.
- SAM (Serviceable Addressable Market): This is the slice of your TAM you can actually reach with your current product, sales model, and geographic focus. For ConnectSphere, let's say they're only targeting English-speaking agencies for the first two years. That immediately cuts the market by 20%. Our SAM is now $22.08 million.
- SOM (Serviceable Obtainable Market): This is the piece of your SAM you can realistically capture in the next 3-5 years, accounting for competitors and market penetration speed. A typical goal for an early-stage SaaS is 5-10%. If ConnectSphere aims for a solid 8% market share, their SOM is $1.77 million.
See what we did there? We took a massive, abstract number and boiled it down into a concrete, actionable plan that can directly guide your go-to-market strategy. That's how you use a TAM calculation.
How Slack Defined a $27 Billion Market
Talking about TAM in theory is one thing, but seeing how a real-world titan used it to build an empire is a masterclass. Slack’s story shows how an ambitious TAM isn't just a number for a pitch deck—it's a compass that can guide your product, rally investors, and lead to a legendary exit.
It's not just about the math; it’s about the narrative.
When Slack first appeared, it would have been easy to cram them into a tiny box: "Internal messaging for tech startups." Any free TAM calculator plugged with those assumptions would have spit out a small, uninspiring number.
But Slack’s founders thought bigger. They didn’t see themselves as a replacement for AIM or GChat. They saw themselves as the replacement for internal email.
Reframing the Competitive Landscape
The genius in Slack’s strategy was how they defined their competition. It wasn’t other chat apps like HipChat. It was the entire, bloated, inefficient beast of internal business communication. Their S-1 filing was a work of art, positioning them against the soul-crushing drag of email.
This brilliant move accomplished two things:
- It massively expanded their perceived market size. Suddenly, they weren't fighting for scraps of the "team chat" pie. They were going after the entire multi-billion-dollar "business communication" budget.
- It elevated their entire value proposition. Slack wasn't just another tool. It was a fundamental shift in how work gets done.
They didn't just enter a market; they created a category and put themselves at the center.
From the Field: "This is a huge lesson for any SaaS operator. Stop and question the market category you think you're in. Ask yourself: What's the bigger, more painful, more expensive problem we're really solving? Your TAM needs to tell that bigger story."
The Math Behind the Story
This grand vision wasn't just fluff; it was anchored by a straightforward bottom-up TAM calculation. They started with roughly 1.3 billion knowledge workers worldwide. Then, they attached a reasonable price tag—an average willingness to pay of around $100 per user per year. Do the math, and you land at a $35 billion TAM.
That one number did so much work. It justified their entire strategic roadmap, made their eventual $27 billion acquisition by Salesforce feel like a logical outcome, and gave them the confidence to expand. You can find more examples of how TAM calculations shape business strategy at Business Initiative.
It was a defensible, bottom-up calculation that told investors a powerful story about their massive, long-term potential.
Actionable Lessons from Slack's Playbook
For founders using a free TAM calculator, Slack's journey offers solid, actionable takeaways:
- Challenge Your Market Definition. Are you "project management software," or are you "the operational hub for professional services firms"? One of those stories is bigger—and more valuable.
- Anchor Your TAM in Your Value. Your market size should be directly connected to the problem you solve. If your software saves companies millions in wasted time, your TAM is a slice of that value.
- Let Your TAM Guide Your Roadmap. A big TAM should inspire a big vision. Use your market analysis to decide what to build next to grab a larger piece of that pie.
Don't Let a Fluffy TAM Sink Your Pitch
A massive TAM figure looks great on a slide, but if it’s built on flimsy assumptions, it will crumble under the first tough question from a VC. This is your reality check. The numbers you plug into any free TAM calculator are only as good as the research backing them up.
The Most Common Founder Mistakes
Nothing sets off an investor's alarm bells faster than a TAM that feels untethered from reality. They've seen thousands of pitches and can spot these common errors from a mile away.
Here’s what they’re looking for:
- Wildly Optimistic Penetration Rates: Thinking you'll capture 30% of the market in three years ignores the friction of long sales cycles, customer inertia, and the difficulty of building a brand from scratch.
- Ignoring Competitors: Claiming you have no competitors is an instant credibility killer. Every problem has a solution, even if it's a clunky spreadsheet. Acknowledging competitors shows you understand your customers' world.
- Using Stale or Irrelevant Data: Pulling numbers from a three-year-old industry report is just lazy. Markets move fast, and using outdated figures signals you haven't done your homework.
These aren't just fundraising mistakes; they're business mistakes. They lead you to build the wrong GTM strategy, hire too many salespeople, and set unrealistic goals that will burn out your team.
From the Field: "In the early days of my first SaaS, we presented a huge TAM based on a top-down report. An investor politely asked, 'How many of those potential customers have the budget for your solution right now?' We didn't have a good answer. It was a painful, but valuable, lesson in grounding our numbers in reality."
A Practical Checklist for Validating Your Numbers
So, how do you make your TAM defensible? You pressure-test every single assumption. Think of your TAM not as a fact, but as a hypothesis that needs to be proven.
Here’s a quick, actionable checklist.
Cross-Reference Your Methodologies
The most believable TAM calculations never rely on a single method. Triangulate your findings. Use a top-down analysis for a big-picture view, then build a meticulous bottom-up case to see if it holds up.
- Top-Down Sanity Check: Does your granular, bottom-up number seem plausible when compared to broader industry reports? If your bottom-up TAM is bigger than the entire market size reported by Gartner, you have a problem.
- Bottom-Up Reality Check: Do your assumptions about the number of potential customers and what they're willing to pay align with what you're seeing in the real world?
If the two numbers are miles apart, that disconnect is an insight. It forces you to dig deeper into your assumptions and figure out where you went wrong.
Talk to Actual Humans
Spreadsheets and reports can only tell you so much. The most important validation step is talking to your potential customers. Run a series of customer discovery calls with folks in your Ideal Customer Profile (ICP). This isn't a sales pitch. Your only job is to listen and ask questions that validate your core assumptions:
- "How are you currently solving [the problem your SaaS addresses]?"
- "What's your budget for tools that help with this?"
- "If a solution existed that did X, what kind of value would that create for your business?"
The answers you get are pure gold. They will either confirm or completely destroy your assumptions about ACV, market need, and the size of your serviceable obtainable market (SOM).
Analyze Your Competitors' Revenue
Your competitors are a fantastic source of validation. If you have publicly traded rivals, their annual reports are a goldmine. They often disclose customer counts, revenue per segment, and growth rates that can serve as a benchmark.
For private competitors, do some detective work. Look at their pricing pages, check job postings for sales roles (a sign of expansion), and use tools to estimate their web traffic. By piecing together these data points, you can build a much more realistic picture of what’s possible in your market. For a deeper dive, our guide on how to perform a gap analysis offers a structured way to see exactly where you stand.
Turning Your TAM Into an Actionable GTM Strategy
So, you've rolled up your sleeves, wrestled with the assumptions, and used a free TAM calculator to nail down some numbers you can actually defend. Great. Now what? A meticulously researched TAM, SAM, and SOM is completely useless if it just gathers dust in a pitch deck.
Its real value comes alive when you use it as the blueprint for your go-to-market (GTM) strategy.
Aligning Sales Territories and Targets with SOM
Think of your Serviceable Obtainable Market (SOM) as the sales team's game plan for the next 12-18 months. It's the specific, winnable slice of the market you're going after right now, and it should directly shape how you carve up territories and set quotas.
Actionable Playbook:
- Territory Planning: Instead of hiring reps to cover the entire country, use your SOM data to create territories based on account density in key regions. Concentrate your resources where the real money is.
- Realistic Quota Setting: Knowing your SOM was $2 million and you had four reps, they could set an achievable quota of $500k per rep. This avoids the classic, morale-crushing mistake of basing quotas on some pie-in-the-sky TAM figure.
This approach stops you from spreading your sales team too thin and makes sure they're fishing in the most well-stocked ponds.
Allocating Marketing Spend Based on Market Segments
Just as SOM guides sales, your SAM (Serviceable Addressable Market) should be the north star for your marketing budget. Your SAM shows you all the customer segments you could realistically serve. The trick is figuring out which of those segments will give you the best bang for your marketing buck.
Actionable Playbook: If your SAM analysis points to two main customer profiles:
- Segment A: Small tech startups (high volume, lower ACV).
- Segment B: Enterprise manufacturing firms (low volume, huge ACV).
You wouldn't market to these two groups the same way. Your marketing budget should reflect this. You might allocate 70% of your spend to content and paid social to capture the high-volume startup segment. The other 30% could be dedicated to high-touch account-based marketing (ABM) to land a few of those enterprise whales.
After you've got a solid TAM, figuring out an essential go to market strategy guide is the next logical step to actually reaching these people effectively.
From the Field: "Your TAM analysis isn't just about market size; it's a segmentation tool. It gives your marketing team the clarity to say 'no' to distracting opportunities and focus their spend on the segments most likely to drive growth."
Letting Market Insights Shape Your Product Roadmap
Finally, your TAM acts as a powerful compass for your product team. It shines a spotlight on the biggest opportunities for growth. That gap between your current SOM and your bigger SAM? That's your next frontier.
Actionable Playbook: Let's say your TAM analysis uncovers a massive, untapped market in European healthcare. For a product manager, this insight is pure gold. It immediately sparks the critical questions that should define the roadmap for the next two years:
- What features are required for GDPR compliance?
- Should we prioritize multi-language support on the platform?
- What are the must-have integrations for healthcare IT systems?
Your TAM provides the strategic "why" behind product decisions. It ensures you’re not just building features in a vacuum but are actively working to unlock bigger, more profitable chunks of your market. To get this all organized, our plug-and-play GTM strategy template can be a huge help in keeping your teams on the same page.
At SaaS Operations, we provide the battle-tested playbooks and templates you need to turn insights into action. We help operators build more efficient and effective businesses by focusing on process, automation, and scorecards that drive real growth. Explore our proven frameworks at https://saasoperations.com.